НАК „НАФТОГАЗ УКРАЇНИ“. Річний звіт англійською (2018 рік) - 9


  Главная      Учебники - Разные     НАК „НАФТОГАЗ УКРАЇНИ“. Річний звіт англійською (2018 рік)


поиск по сайту            правообладателям  


содержание      ..     7      8      9      10     ..


НАК „НАФТОГАЗ УКРАЇНИ“. Річний звіт англійською (2018 рік) - 9


137

136

CORPORATE GOVERNANCE AND CSR

ANNUAL REPORT 2018

2018

Environmental impact minimization

Air protection

Expenditures on environmental protection measures

Understanding the importance of 

environmental safety, sustainable use 

and remediation of natural resources, 

in 2018, Naftogaz group’s production 

companies were the first in the oil 

and gas sector to initiate strategic 

environmental assessment and obtain 

environmental impact statements (EIS). 

In 2014, Ukraine signed an Association 

Agreement with the European Union 

and undertook to implement a national 

environmental law and adopt 29 EU 

environmental directives and regulations 

to achieve European environmental 

standards. Since 18 December 2017, EIS 

has been a mandatory document for the 

extraction industry according to the Law 

of Ukraine "On Environmental Impact 

Assessment”.

In 2018, Ukrgasvydobuvannya prepared 

143 EIS procedures, issued 92 reports 

on planned activities, held 93 public 

hearings, and received 83 EISs (6 more 

statements on the admissibility of 

the company’s planned activities are 

expected from an authorized body).

In April 2018, Ukrnafta received its first 

EIS related to its mining operations 

in the Pasichnianske, Dovbushansko-

Bystrytske, and Lukvynske fields. In 

2018, the Company initiated hearings 

in communities where deposits were 

located and received 12 EISs.  

EIS approval came following collection of 

the necessary materials on the general 

technical characteristics of the area, the 

capacity used, hydrocarbon production 

volume, etc., as well as public open 

presentations and discussions within the 

local community.

In 2018, pollutants emitted into the air 

by Naftogaz group’s stationary sources 

amounted to 67.0 thousand tons  

(45.1 thousand tons in 2017).

In 2018, greenhouse gas emissions by 

Naftogaz group increased to  

7.3 million tons in СО2 equivalent from 

6.8 million tons in 2017. Ukrtransgaz 

(59.9%), Ukrgasvydobuvannya (29.3%) 

and Ukrnafta (10.5%) accounted for 

the largest shares in greenhouse gas 

emissions.

Higher greenhouse gas emissions were 

due to an increase in production drilling 

and the significant increase in  

production enhancement  

operations by Ukrgasvydobuvannya.

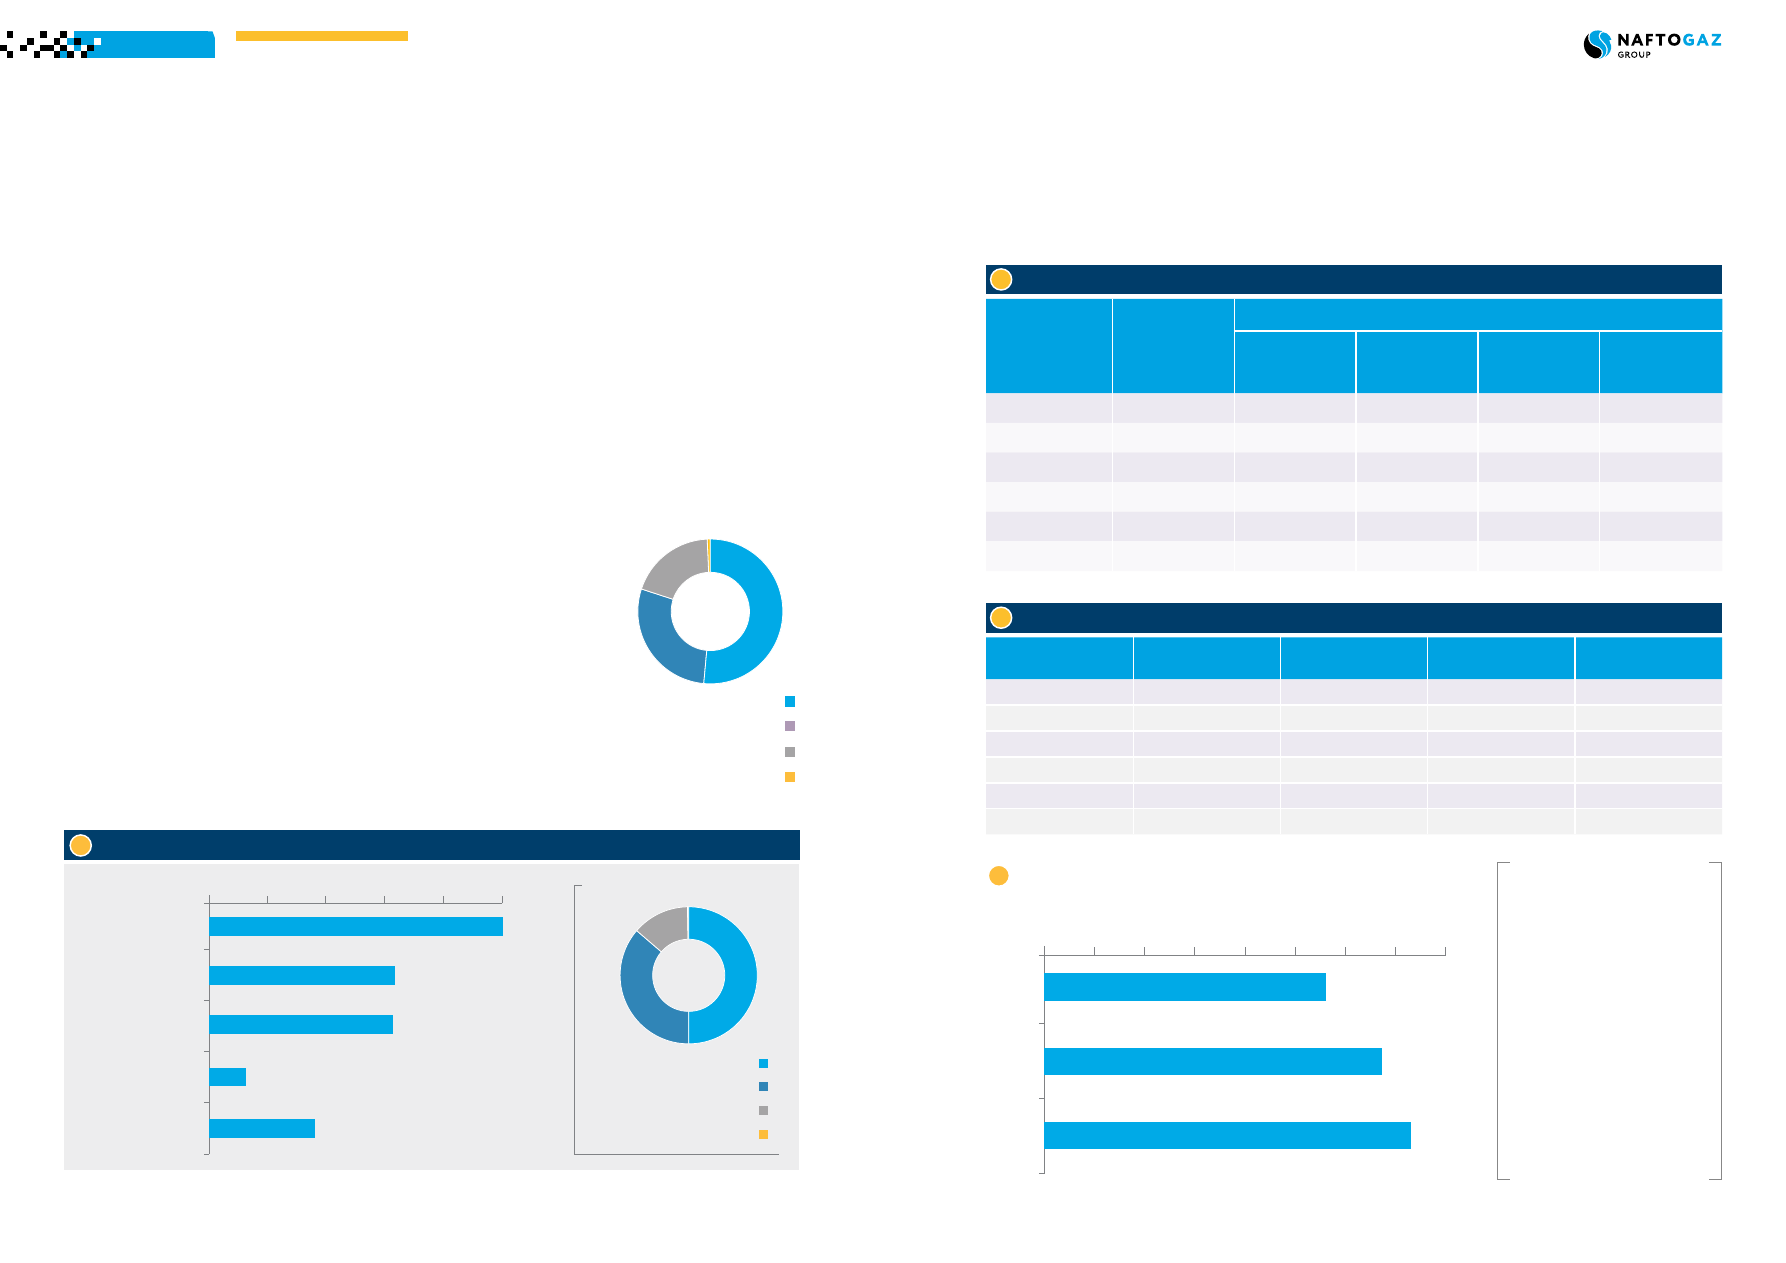
In 2018, Naftogaz group companies spent 

UAH 141.4 million on environmental 

protection, including UAH 3.2 million of 

capital investments (2% of environmental 

protection expenditures) and UAH 138.2 

million of current expenditures (98%).

Capital investments breakdown: soil 

protection and rehabilitation – UAH 3.0 

million, wastewater treatment – UAH 0.2 

million.

Current expenditures on return water 

treatment amounted to UAH 50.4 

million, waste management – UAH 32.0 

million, protection and rehabilitation 

of soil, underground and surface water 

– UAH 31.5 million, air protection – 

UAH 6.3 million, other areas (including 

reduction of noise and vibrational 

impact, radiological safety, biodiversity, 

environmental protection research, etc.) 

– UAH 18.1 million.

UAH 60.4 million was spent on 

environmental protection services. 

Proceeds from the sale of waste 

amounted to UAH 127.8 million, from 

environmental protection services (return 

water treatment) – UAH 0.1 million.

Naftogaz group paid UAH 61.3 million of 

environmental tax and UAH 0.059 million 

of penalties for environmental violations 

(compared to UAH 0.475 million in  

2017).

97% of environmental tax is attributed to 

emissions of air pollutants.

Structure of current environmental protection expenditures in 2018 by areas of activity, UAH million

0

10

20

30

40

50

50.4

Return

water treatment

32.0

Waste

 management 

31.5

Protection and

rehabilitation of soil

18.1

Other environmental

protection 

6.3

Air

protection 

50.4

UAH million

By group companies

Ukrnafta - 

50.0

%

Ukrgasvydobuvannya - 

36.3

%

Ukrtransgaz - 

13.4

%

Other - 

0.3

%

Ukrtransgaz - 

51.5

%

Ukrgasvydobuvannya - 

28.6

%

Ukrnafta - 

19.3

%

Other - 

0.7

%

61.3

UAH million

Structure of environmental  

tax payment in 2018 

by Naftogaz group companies

Group companies

Pollutant  emissions                         

INCLUDING:

Emissions of carbon 

oxide (СО)

Emissions of sulfur 

oxide (SO

2

) and other 

sulfur compounds

Emissions of nitrogen 

compounds  (NО

x

), 

excluding N

2

O

Emissions of 

non-methane volatile 

organic compounds

Ukrtransgaz

18.0

7.5

0.002

10.0

0.5

Ukrnafta

25.6

5.1

0.1

2.6

17.8

Ukrgasvydobuvannya

21.5

14.6

0.2

4.9

1.9

Uktransnafta

1.8

0.005

0.0

0.006

1.8

Other companies

0.02

0.004

0.0

0.002

0.011

TOTAL

67.0

27.2

0.3

17.4

22.0

Emissions of air pollutants by Naftogaz group, ktons

Emissions of greenhouse gases by Naftogaz group in 2018, ktons

Group companies

Emissions of carbon 

dioxide  (СО

2

)

Emissions of methane  

(СН

4

Emissions of nitrogen 

oxide (N

2

O)

Emissions of greenhouse 

gases, СО

2

-eq.

Ukrtransgaz

3707.9

30.2

0.2

4391.7

Ukrnafta

631.1

4.6

0.1

770.9

Ukrgasvydobuvannya

1715.2

20.3

0.03

2151.2

Uktransnafta

2.9

0.1

0.0

4.6

Other companies

1.9

0.6

0.0

14.1

TOTAL 

6058.9

55.7

0.3

7332.5

The Association Agreement 

between Ukraine and the EU, 

the Paris Agreement on climate 

change, provisions of Directive 

2003/87/EC and the Concept 

of State Climate Change Policy 

Implementation until 2030 

approved by Resolution #932-

p of the Cabinet of Ministers 

of Ukraine of 7 December 

2016 provide for Ukraine to 

introduce monitoring, reporting 

and verification systems for 

greenhouse gas emissions.

Greenhouse gas emissions by Naftogaz group

in 2016-2018, ktons СО

2

-eq.

0

1000

2000

3000

4000

5000

6000

7000

8000

2018

2017

2016

5645.0

7332.5

6765.2

СО

2

СH

4

N

2

O

-------------------------------------------------------------------------------------------------------------------------------------------------------------

139

138

CORPORATE GOVERNANCE AND CSR

ANNUAL REPORT 2018

2018

Ukrnafta

Ukrtransgaz regularly monitors tightness 

of shut-off valves, pipelines and other GTS 

equipment to reduce greenhouse gas 

emissions. Identified natural gas leaks are 

eliminated as soon as possible. Monitoring 

results are reported every six months. 

According to the results of 2018, the 

emissions of greenhouse gases per 

unit (carbon intensity) by Ukrtransgaz 

amounted to 32.5 ths. t of СО

2

 –eq./

mcm, in 2017 – 33.0 ths. t of СО

2

 –eq./

mcm.

In 2018, a 10-year plan for Ukrainian 

GTS modernization (2018-2027) was 

developed to bring production facilities 

in line with European reliability, safety 

and environmental standards. There are 

plans to reconstruct four compressor 

stations: Yahotyn, Dykanka, Romny, and 

Bilche-Volytsia Compressor Department 

4(boosting compressor station at the 

underground gas storage facility).

Naftogaz group companies mostly 

generate drilling waste (drill cuttings, 

waste drilling mud and drilling waste 

water); municipal solid waste; petroleum 

products and oil slime; scrap ferrous 

metals; worn out and damaged 

automobile tires; construction waste

1

.

In 2018, Naftogaz group generated 210.2 

thousand tons of waste of which 77% 

was drilling slime. Ukrgasvydobuvannya 

accounted for the largest share of waste 

(79%). 

Every year Ukrnafta develops and 

implements measures to eliminate 

consequences of long-term oil and gas 

production as well as to reduce gas 

pollution in the town of Boryslav. More 

than UAH 35.3 million was spent on 

these activities in 2018, including the 

following:

•  gas chemical control of the territory 

near well-heads, pit-wells and 

control areas of the town within the 

boundaries of the mine allotment;

•  repair and insulation works in the town 

of Boryslav at 33 operating wells, 4 

previously abandoned wells, 10 pit-

wells were discovered and arranged;

•  special degassing wells were drilled;

•  repair and maintenance of previously 

drilled special degassing wells, 

discovered and arranged pit-wells;

•  gas pollution control at special 

degassing wells and pit-wells.

Ukrnafta initiated an independent 

environmental audit of the town of 

Boryslav. Members of the Boryslav 

Town Council, together with Ukrnafta 

and Naftogaz experts, developed a 

framework for Lamor company to 

conduct a comprehensive study of the 

environmental situation in the town of 

Boryslav. This included the preparation 

of organizational, technical, and 

social recommendations to reduce 

any manmade burden and social 

tension, improve sanitary conditions, 

and ensure the town’s environmental 

sustainability.

The Boryslavske field is developed 

according to the “Additional development 

program to extract the remaining oil 

and reduce gas pollution” designed to 

improve the environmental situation in 

the town. 

Ukrtransgaz

Waste management

Water resources

1

 Resolution #33 of the State Regulatory Service of Ukraine of 15 July 2014 suspended SSRS 2.2.7.029-99 “Hygienic requirements to industrial waste management and classification of waste based on its hazard to public health” with regard to waste 

hazard classes, so the report does not disclose this information.

Waste generated by Naftogaz group in 2018 by type

210.2


ktons

By group companies

Ukrgasvydobuvannya - 

79.2

%

Ukrnafta - 

18.7

%

Ukrtransgaz - 

1.5

%

Ukrtransnafta - 

0.4

%

Other - 

0.2

%

0

10

20

30

40

50

60

70

80

Drilling waste

Municipal solid waste

Scrap ferrous metals

Waste petroleum products

and oil slime

Worn out

and damaged automobile tires

0.4%

Other

0.6%

4.2%

5.3%

12.6%

76.9%

Ukrnafta has relevant licenses and 

equipment to dispose of hazardous 

waste at its own facilities.

To manage drilling waste, Naftogaz 

group uses technologies for mud 

reclamation and drilling waste water 

treatment and reuse.

In 2018, the total water intake by 

Naftogaz group amounted to 5 139.2 tcm 

(5 292.0 tcm in 2017), including 1 274.1 

tcm of underground water, 3 284.8 tcm 

of surface water, 574.6 tcm from public 

water supply, and 5.7 tcm from other 

sources. 

In 2018, Naftogaz group used  

4 664.6 tcm of water (4 418.5 tcm in 

2017), including 1 042.1 tcm for  

drinking, sanitary and hygienic needs  

(1 054.6 tcm in 2017) and 3 267.0 tcm  

for operating needs (3 122.0 tcm in 

2017).

Water use by Naftogaz group companies, tcm

0

1000

2000

3000

4000

5000

Ukrtransgaz

Other

Ukrgasvydobuvannya

Ukrnafta

Naftogaz group

2017
2018

4664.6

2832.6

1050.5

611.2

170.3

4418.5

2650.0

947.8

645.4

175.3

Water use by purpose

operating needs

drinking, sanitary and hygienic needs

other

70.0%

7.6%

22.3%

Waste management at Naftogaz group in 2017-2018, ktons

Waste

2017

2018

Generated waste, of which:

210.1

210.2

disposed of

1.9

21.9

burnt

0,010

0.06

removed

152.7

151.4

transferred to other organiza-

tions

52.9

47.7

Naftogaz group’s water intake by source

Surface water

Underground water

Public water supply

Other

24.8%

63.9%

11.2%

0.1%

5139.2

tcm

-------------------------------------------------------------------------------------------------------------------------------------------------------------

141

140

CORPORATE GOVERNANCE AND CSR

ANNUAL REPORT 2018

2018

Naftogaz group records its water 

consumption and discharge, using 

standard forms. Most of facilities are 

equipped with metering devices. All 

water meters are duly checked and 

sealed. Naftogaz group used water 

resources within the set limits.

Reused and recycled water: 200.9 mcm 

in recycling water supply systems and 5.8 

mcm in reuse water supply systems.

In 2018, a total of 1 547.6 tcm of return 

(waste) water was discharged (1 702.4 

tcm in 2017), including 726.3 tcm to 

waterbodies (reservoir, pond, river), 

416.3 tcm to sewerage system, 271.4 tcm 

to disposal fields, 32.4 tcm to cesspits, 

101.3 tcm to wastewater treatment 

facilities.

In 2018, 7 377.0 tcm of associated and 

deposit water was used to maintain 

formation pressure. Associated and 

deposit water extracted together 

with hydrocarbons was returned 

underground through intake wells of 

the formation pressure maintenance 

system or through absorbing wells 

within some projects according to 

the current legislation. This helped 

significantly reduce the negative impact 

on surface and ground waters as well as 

to preserve commercial lands.

In 2018, Naftogaz group kept its treated 

return water discharges within relevant 

MPDs. Accredited laboratories are 

involved to perform tests.

In 2018, Ukrtransgaz continued to 

repair the Urengoy-Pomary-Uzhhorod 

trunk pipeline in cooperation with 

bioresources management advisors. 

Environmental studies were held to 

develop a biodiversity management plan 

for protection of Dacha Galileya forest 

reserve (Ternopil region). The studies 

were based on generally accepted 

zoological, floristic and geobotanical 

methods.

Ukrnafta performs production 

operations in areas that are adjacent 

to the Andriyashevsko-Gudimovsky 

national hydrological reserve. The 

monitoring held in 2018 identified 

no negative impact of oil and gas 

production infrastructure on  

forest, meadow and wetland 

ecosystems.

To protect soils and lands, NJSC Naftogaz 

of Ukraine Integrated Environmental 

Protection Action Plan for 2015-2020 

provides for response measures to 

eliminate oil and oil product spills, 

including elimination and reclamation 

of oil storage pits. In 2018, Naftogaz 

group reclaimed 464.6 hectares of 

lands affected by production operations 

(159.0 hectares in 2017).

1)  The Directive (EU) 2015/2193 (MCP 

Directive) regulates emissions of 

certain air pollutants from combustion 

plants with a heat output equal to 

or greater than 1 MW and less than 

50 MW (“Medium Combustion 

Plants”). Although the MCP Directive 

is a supplement to Directive 2010/75/

EC, it is not included in the list of 

directives Ukraine has committed to 

implement. GMK-10 and GMK-8 gas 

internal combustion compressors used 

by Naftogaz group are obsolete and 

worn out. They do not meet the EU’s 

NOx and CO emission standards. The 

implementation of GMK replacement 

programs and development of a 

National Emission Reduction Plan for 

medium combustion plants, including 

obsolete engines, are key to the 

problem. 

2)  A complicated and long (from three 

to six months) procedure to obtain 

emission permits for drilling rigs, 

especially for shallow wells drilled by 

mobile units within a year.

3)  Shortage of environmental experts at 

some production facilities of Naftogaz 

group.

4)  Leaks of hydrocarbons and deposit 

water due to worn-out equipment, 

especially pipelines, and unauthorized 

interference.

5)  Waste. Business entities with waste 

generation rate exceeding 1000 

cannot obtain waste management 

permits as required by law due to a 

several-year delay in the development 

and implementation of the licensing 

procedure. The problem remains 

unsolved, as there is no regulation 

in place that would classify waste by 

hazard. Most oil and gas companies in 

Ukraine are operating without permits, 

being hostages of circumstance.  


The state authorities suspended SSRS 

2.2.7. 029-99 regulation classifying 

waste by hazard, while there is no 

National List of Waste compliant with 

international requirements. 

6)  Water consumption and special 

water use. Deficient regulatory 

and legal framework in terms of 

electronic reporting by water users 

on the amount of underground 

water extracted from artesian wells 

(Order #10 of the Ministry of Ecology 

and Natural Resources of Ukraine 

of 23 March 2016) and calculation 

procedure for water use and discharge 

(Art. 49 of the Water Code and Order 

#234 of the Ministry of Ecology and 

Natural Resources of Ukraine of 23 

June 2017).   

The fulfillment of these requirements 

in the proposed format will 

require significant costs and other 

unreasonable expenses by industrial 

water users. In most cases, the result 

may not justify costs, which will exceed 

tax payments for special water use.

7)  Inconsistency of bylaws with the Law 

of Ukraine “On Environmental Impact 

Assessment”, which became effective 

on 18 December 2017. For example, 

Biodiversity

Soil protection

Environmental problems and risks

1)  Implement the Environmental Protection and Social Action 

Plan, which is an annex to the loan documentation under IBRD 

guarantees (approved by Executive Board Meeting Minutes 

#191 of 12 May 2017).

2)  Sign the Project Agreement on Methane Emissions Reduction 

with the EBRD and implement the project at the facilities of 

Naftogaz group.

3)  Complete the World Bank Pilot Project and introduction of 

MRV system at some facilities of Naftogaz group.

4)  Perform environmental audits at Naftogaz group companies 

in accordance with SOU “Environmental Protection. 

Environmental Audit of Activities of NJSC Naftogaz of Ukraine 

Group”. Basic Provisions”.

5)  Complete the development of technological standards for 

existing and new gas turbines and engines with nominal heat 

capacity from 1 to 50 MW.

6)  Create a unified monitoring system for environmental 

activities at Naftogaz group based on MS Consulting software.

7)  Bring internal documents in line with legislative changes: 

-  DSTU 41-00032626-00-023-2000 “Environmental protection. 

Reclamation of land during the construction of oil and gas 

wells”; 

- SOU 73.1-41-11.0.01: 2005 “Environmental protection. 

Environmental measures during the construction of oil and 

gas wells”.

Plans for 2019: 

to obtain a license for a new field, an 

environmental impact assessment is 

needed, while business entities that 

just intend to participate in an auction 

for a license are not eligible to hold the 

impact assessment, as it can be done 

exclusively by an owner (user) of the 

field when preparing the development 

project.

-------------------------------------------------------------------------------------------------------------------------------------------------------------

143

142

2018

CORPORATE GOVERNANCE AND CSR

ANNUAL REPORT 2018

PROCUREMENT MANAGEMENT

The reform of the procurement system 

has been one of the first and most 

important reforms of Naftogaz group. 

For Naftogaz group, the main criterion 

for procurement effectiveness is the best 

quality at an economically advantageous 

price, subject to compliance with 

the principles of a transparent, non-

discriminatory, competitive and open 

procurement process.

Legal, financial, commercial and 

corruption risks arise in the process of 

procurement. One of the Company’s 

core values is zero tolerance to any form 

of corruption, so when procuring, strict 

adherence to anti-corruption legislation 

is controlled.

Improvement of Procurement Procedures 

in 2018:

•  the normative definition of the 

expected cost of procurement at the 

enterprises of Naftogaz group was 

finalized;

•  the obligatory provision of security 

to be provided by participants in case 

of procurements of more than UAH 

10 million was established in order to 

reduce the risk of participation of false 

companies in procurement procedures;

•  the transition from “paper” to 

electronic procurement was made, 

ensuring compliance with transparency 

principles in procurement procedures;

•  the procedure of strategic procurement 

with world-class suppliers was 

implemented allowing access to 

the most advanced technologies to 

ensure the prompt execution of works 

of increased complexity and timely 

execution of gas extraction programs;

•  a procurement mechanism under 

framework agreements was introduced, 

which allows reductions in the number 

of procurement procedures and 

periods for concluding contracts;

•  project financing was attracted at the 

expense of the European Investment 

Bank to cover the project costs 

intended to improve reliability and 

increase hydrocarbon production, 

which made it possible to receive 

additional financial resources 

on favorable terms and increase 

investment attractiveness; 

•  the possibility to make procurements 

under “turn-key”  contracts 

was implemented, which places 

responsibility on the general contractor 

for the fulfillment of all obligations 

under the contract and allows 

minimization of customer risks.

•  centralization of procurements by 

changing from fragmented regional 

model of Tender Committees to 

centralized procuring organization;

•  creation of a training center for buyers 

of Naftogaz group (training, lectures by 

key leaders and professionals, exchange 

of experience and combination of 

practices, analysis of procurement 

efficiency, analysis of AMCU practices);

•  automation of key procurement 

processes to facilitate access to 

analytical and statistical information;

•  pilot project to create VENDOR LIST for 

TOP-3 categories of goods.

In 2018, the group enterprises saved 

UAH 5.2 billion due to adherence by 

Naftogaz group to the basic principles of 

procurement activities, in particular to 

open communication with market rep-

resentatives, advance announcement of 

procurements, ensuring equal conditions 

for all procurement participants, and zero 

tolerance towards corruption.

5%

Total quantity and value of announced procurements in 2018

49%

32%

8%

4%

2%

27%

23%

19%

18%

7%

3%

3%

Ukrtransgaz

3 689 

procurements

37 549 

UAH mn

Ukrtransnafta

850

 procurements

5 924

 UAH mn

Naftogaz of Ukraine

464 

procurements

1 579 

UAH mn

Ukravtogaz

256 

procurements

91 

UAH mn

Naftogaz-
Enerhoservis

15 

procurements

2 

UAH mn

Naftogaz
Tsyfrovi
Tekhnolohii

16 

procurements

59 

UAH mn

Naukanaftogaz

145

 procurements

17 

UAH mn

Gaz Ukrainy

124 

procurements

32 

UAH mn

Chornomornaftogaz

35 

procurements

107 

UAH mn

Kirovogradgaz

98 

procurements

29 

UAH mn

*Zakordonnaftogaz made 

2 

procurements for UAH 

0.2 

mn

Vuhlesyntezgaz made 

5 

procurements for UAH


2.4 

mn

Ukrspetstransgaz

101 

procurements

77 

UAH mn

Ukrgasvydobuvannya

5 647 

procurements

66 417 

UAH mn

541

*


procurements

326


UAH mn

11 447


procurements

111 886


UAH mn

Actual saving on procurements in 2018

Ukravtogaz
Gaz Ukrainy
Kirovogradgaz
Naukanaftogaz
Ukrspetstransgaz
Zakordonnaftogaz
Chornomornaftogaz
Naftogaz-Enerhoservis
Vuhlesyntezgaz Ukrainy
Naftogaz Tsyfrovi Tekhnolohii

Ukrgasvydobuvannya

Ukrtransgaz

Ukrtransnafta

Naftogaz

Other*

69

%

25

%

2

%

1

%

3

%

0

500

1000

1500

2000

2500

3000

3500

4000

3 599

1 288

154

100

14

5 155

UAH mn

UAH mn

Procurements via ProZorro in 2018

8 273

 contracts

62 200

 UAH mn

16%

84%

Residents

Non-residents

TOP-7 external suppliers in 2018, UAH mn

ERU TRADING

SCHLUMBERGER SERVICES UKRAINE

LLC Trafigura Ukraine

ZORYA-MASHPROEKT

INTERPIPE UKRAINE

Solar Turbines International Company

TACROM SERVICES S.R.L.

0

500

1 000

1 500

2 000

2 500

3 000

3 500

4 000

Natural gas

Natural gas

Reconstruction of a compressor station and equipment maintenance

Steel, casing and tubing pipes

Pumps and compressors

Services related to gas production and well operations

Services related to gas production and well operations

1 139

1 810

1 818

2 646

2 905

2 911

3 702

Tasks for 2019:

-------------------------------------------------------------------------------------------------------------------------------------------------------------

147

146

2018

FINANCIAL STATEMENTS

ANNUAL REPORT 2018

Sergiy Konovets   

FINANCIAL STABILITY

2018 was the third consecutive year when 

Naftogaz group demonstrated a positive 

financial result. Operating income for the 

year amounted to UAH 26.4 billion, net 

profit was UAH 11.6 billion, and net cash 

flow from operating activities stood at 

UAH 71.6 billion.

The years 2017-2018 have been import-

ant for the group, since Naftogaz won the 

Stockholm Arbitration case against Gaz-

prom, which has had a positive impact 

on the financial result of 2017, increasing 

the group's profit by UAH 12.6 billion. 

However, the group has also had some 

tax consequences related to the part of 

the compensation payable according 

to the transit decision, which led to an 

increase in VAT obligations of UAH 4.8 bil-

lion in March 2018, which resulted in 

reduced net income in 2018.

The group’s receivables management is 

our constant focus, especially in the inte-

grated gas business and natural gas trans-

mission segments. Unfortunately, the in-

sufficient level of settlements, especially 

by the counterparties to whom we must 

supply gas on preferential terms (PSO), 

adversely affects our financial results. 

This is evident in increased expenses on 

bad debts. In 2018 alone, these expenses 

amounted to UAH 19.4 billion.

As in previous years, the integrated gas 

business and natural gas transmission 

segments are leaders in terms of oper-

ating income. In 2018, they contributed 

UAH 35.2 billion and UAH 8.2 billion 

respectively to the operating income of 

the group. These segments are the main 

contributors to the group’s operating 

cash inflow: the integrated gas business 

segment earned almost UAH 33.3 billion, 

and the natural gas transmission segment 

reached UAH 26.8 billion.

In 2018, the group continued to generate 

a positive cash flow from its operating 

activities. Taxes and dividends paid to 

the budget for the year amounted to 

UAH 109.1 billion and UAH 29.5 billion 

respectively, maintaining the group’s po-

sition as the largest taxpayer in Ukraine. 

A stable positive cash flow from op-

erating activities enabled significantly 

increased investment in development in 

2018. Investment activity almost doubled 

from UAH 13.9 billion in 2017 to almost 

UAH 26 billion in 2018. This was mainly 

investment in drilling, the purchase of 

new drilling rigs, and other projects to 

ensure an increase in the production of 

Ukrainian gas as one of the group’s most 

important strategic priorities.

In addition, operating cash flow has 

become the main source for paying in-

terest on the existing loan portfolio and 

reducing the credit burden by repaying 

loans, which reduced the value of the 

loan portfolio from UAH 59.3 billion as of 

December 31, 2017 to UAH 56.0 billion 

as of December 31, 2018.

Financing all long-term investments with 

shareholder equity alone is not an ideal 

option. Therefore, taking into account 

Sergiy Konovets 

Deputy CEO (CFO) 

their liquidity needs, the group attracts 

credit capital. At the same time, the 

shareholder withdraws part of his capital 

as a result of net profit distribution. Ac-

cording to the results of 2017, the share-

holder distributed 75% of profits, which 

is UAH 29.5 billion, paid by the group to 

the budget in 2018. This is the money 

that is paid to the shareholder and can-

not be used by the group in its activities. 

This is the reason why the group borrows 

funds. The current low net debt-to-equity 

ratio, in our opinion, allows us to attract 

external financing without a significant 

risk of deterioration in the financial 

situation. Therefore, attracting external 

financing remains our priority, which will 

enable the implementation of investment 

projects and funding for the gas  

purchase program. In 2019, the  

group plans to attract about  

UAH 60 billion due to the issuance 

of Eurobonds and new loans.

At the same time, the issue of entering 

capital markets and attracting external 

Naftogaz group’s profit before tax in 2018, UAH billion 

Integrated

gas business

Transportation

and refining 

of oil and sales 

of oil products

Gas transit

Domestic 

gas transmission

Gas storage

Ukrnafta 

financial result

Other

operations

Non-refundable VAT 

on the compensation 

under the transit award

Provisions for 

litigation and 

other purposes

Net financial

expenses

Other unallocated

revenues and

expenditures

Profit 

before tax

+35.2

+20.5

+1.1

+8.2

+11.4

-3.2

-1.3

-2.7

-4.8

-4.1

-4.8

-14.5

financing for Naftogaz group, which is a 

state-owned company, needs agreement 

from the Cabinet of Ministers of Ukraine 

and the Ministry of Finance. Based on 

prior experience, this will be a long  

process. The impossibility of timely 

attracting such funds puts at risk the 

implementation of the capital investment 

program and achievement of the  

strategic objectives of the group to in-

crease production and maintain the nec-

essary level of gas in the UGS to ensure 

reliable gas supply during the heating 

period.

From a financial point of view, we are 

ready to face the risk of zero transit 

revenues after unbundling. Our financial 

condition mainly depends on the further 

reform of the gas market in Ukraine and 

its impact on the results of the integrated 

gas business of the group. In 2020, even 

if no transit revenues are forthcoming, a 

free gas market will take shape according 

to government decisions and agreements 

with the IMF. We expect to be able to 

sell gas directly to the final consumer at 

market prices and keep the profitability 

of the group at relatively high levels.

Our loan-to-income 

ratio enables  

us to fund 

a significant share  

of our operations  

with borrowings, 

posing no risk

-------------------------------------------------------------------------------------------------------------------------------------------------------------

149

148

2018

FINANCIAL STATEMENTS

ANNUAL REPORT 2018

KEY PERFORMANCE  

INDICATORS IN 2018

According to the results of 2018, the 

group recorded net income of UAH 256.3 

billion, which is 12.7% higher than in 

2017. This income growth is mostly in the 

integrated gas business segment, which is 

described below.

At the same time, the net profit of Naf-

togaz group only reached UAH 11.6 bil-

lion in 2018 compared to UAH 39.4 billion 

in 2017. This decrease is due to the finan-

cial effect of recognizing the decisions of 

the Arbitration Tribunal in the arbitration 

proceedings on natural gas sale and tran-

sit between Naftogaz and Gazprom. While 

in 2017, Naftogaz group posted net profit 

of UAH 12.6 billion as the difference be-

tween income according to the decision 

taken in the Arbitration Proceeding on gas 

transit and the expenses according to the 

decision taken in the Arbitration Proceed-

ing on sale and purchase of gas, in 2018, 

Naftogaz group recognized UAH 4.8 billion 

of non-reimbursed VAT on the amount 

to be paid to Naftogaz according to the 

ruling of the Arbitration Tribunal in the 

proceeding on gas transit. This decrease 

in net profits was also due to an increase 

in the cost of creating a debt reserve of 

UAH 7.0 billion, which relates to balanc-

ing activities in the domestic natural gas 

transmission segment, and to the im-

pairment of receivables under the prod-

uct-sharing agreement between Naftogaz 

and the Egyptian General Oil Corporation 

as part of other activities. Additionally, 

the amount of net profit was significantly 

affected by creation of a litigation reserve: 

following the court decision that was ad-

opted in 2013 and its execution delayed 

till May 2019, the group should reserve 

more than 1.0 bcm of natural gas to cover 

shortages in the GTS underground gas 

storage facilities. The cost of creating 

this reserve amounted to over UAH 10.7 

billion in 2018. At the same time, an in-

crease in gross income has added UAH 

7.2 billion to net profits in 2018 compared 

to 2017, mainly due to improvement of 

the result of the Integrated Gas Business 

segment.

In terms of performances, the integrat-

ed gas business is the largest business 

segment of the group, which combines 

production, imports, sale and supply 

of natural gas to various categories of 

consumers, as well as the sale of related 

raw materials. In the total structure of 

the group's revenues, the integrated gas 

business contribution is 42.3%.

Total sales of natural gas increased by 

8.6% or by 1.5 bcm in 2018 due to colder 

weather in February-March 2018 com-

pared to the same period in 2017. The 

household category was the only one to 

demonstrate a slight decrease in sales, 

dropping by 0.6 bcm. The result of the 

integrated gas business segment has 

improved in 2018 by UAH 1.6 billion.

The segment includes activities related 

to transportation, sale and supply of oil, 

gas condensate, petroleum products, and 

related products.

Trading of petroleum products

In 2018, petroleum product sales 

decreased by 7.5% or by 41 thousand 

tons, while liquefied gas sales remained 

almost unchanged. The decline in sales 

has worsened the segment's result by UAH 

0.6 billion. However, due to an increase in 

market prices for petroleum products in 

2018, revenue improved by UAH 2.6 billion 

and reached UAH 0.3 billion. 

Domestic oil transmission and 

transit

During 2018, the volume of oil transit 

decreased by 4.3% or by 602 thousand tons, 

due to a decrease in the transit of oil from 

Russia through Ukraine to EU countries, 

including in the direction of Hungarian 

refineries (-6.1%), Czech Republic (-1.4%) and 

Slovakia (-5.0%). The reduction of oil transit 

in the direction of Hungary and Slovakia 

(MOL company) was due to the decrease of 

orders for the purchase of Russian oil to be 

transmitted in 2018: the oil contained 1.8% 

sulphur which did not meet the customer's 

requirements of 1.5%. So the financial result 

of the segment slightly decreased, by UAH 0.3 

billion, or by 17%.

At the same time, the volume of domestic 

transmission remained at the level of 2017 

and amounted to 2 101 thousand tons. The 

segment remained unprofitable in 2018, 

and its financial result amounted to UAH 

0.9 billion.

Integrated gas business 

Petroleum products transportation, refining and sale

Performance improvement factors for Integrated gas business

+10.5

-11.7

+15.6

-9.3

-2.9

-0.6

2017

Sales volume

growth

Decrease in 

imported gas

cost price

Decrease in 

domestically 

produced gas 

cost price

Increase in

amortization

Other

changes

2018

Selling price

growth

33.6

35.2

Receivables for natural gas supply

Regional gas distribution companies 

for resale to households

Heat producers to households

Other customers under PSO

Resale to non-PSO consumers 

Trade receivables < 90 days 

Trade receivables = 90-365 days

30.1

UAH billion

4.8

UAH billion

7.1

UAH billion

17.2

UAH billion

16.9

UAH billion

30.3

UAH billion

14.1

UAH billion

20.4

UAH billion

Trade receivables > 365 days

Provision for impairment

Trade receivables < 90 days

Trade receivables = 90-365 days

Trade receivables > 365 days

Provision for impairment

Trade receivables < 90 days

Trade receivables = 90-365 days

Trade receivables > 365 days

Provision for impairment

Trade receivables < 90 days

Trade receivables = 90-365 days

Trade receivables > 365 days

Provision for impairment

2017

2018

2017

2018

2017

2018

2017

2018

20.2

9.7

0.1

-1.2

-1.4

-3.5

-16.8

-15.3

0.1

0.4

0.2

-1.1

-4.23

-7.6

23.1

7.1

8.19

2.4

3.53

3.8

3.9

12.6

3.0

3.8

0.4

1.4

1.7

1.6

16.8

1.7

15.0

-------------------------------------------------------------------------------------------------------------------------------------------------------------

151

150

2018

FINANCIAL STATEMENTS

ANNUAL REPORT 2018

About 40% of the natural gas supplied 

by the Russian Federation to European 

countries in 2018 and  

2017 was transmitted via Ukrainian 

trunk gas pipelines. In 2018, the total 

volume of natural gas transmitted 

through the territory of Ukraine from 

the Russian Federation to European 

countries and Moldova is 86.8 bcm, 

which is less than in 2017 by 6.7 bcm, 

or 7.2%. One of the main factors that 

reduced transit volumes through the 

Ukrainian GTS was the increase  

in the volume of Russian gas transit to 

Europe via the Nord Stream  

pipeline. 

As in previous periods, revenues from natural 

gas transit account for a significant part in the 

group's revenues, representing 28.2% of the 

group's revenues for 2018. The financial result 

of the gas transit segment decreased from 

UAH 12.7 billion in 2017 to UAH 8.1 billion  

in 2018, mainly due to a decrease  

in transit.

The financial result of domestic natural 

gas transmission for 2018 decreased by 

UAH 2.3 billion. The main negative factor 

affecting the result was the increase in 

the debt reserve during this period, due 

to significant volumes of unpaid balancing 

services. 

According to the results of 2018, the 

volume of natural gas withdrawn from 

the UGS increased by 65% or by 4.2 bcm. 

This was due to the active natural gas 

withdrawal in February-March 2018 

because of a drop in temperatures at the 

end February-March 2018. The volume 

of gas injected into the UGS in 2018 also 

slightly increased as compared to the 

previous year, by 0.7 bcm. Against this 

background, the financial result improved 

by UAH 1 billion, however the segment 

remained unprofitable and its losses 

amounted to almost UAH 1.3 billion 

compared to UAH 2.4 billion in 2017.

This segment includes the results of a joint 

venture covering hydrocarbon exploration 

and a development concession agreement 

with the Arab Republic of Egypt, as well as 

the proceeds from the sale of materials and 

services. The segment's result deteriorated 

due to the recognition in 2018 of receivable 

impairment losses under the product-sharing 

agreement of almost UAH 3.1 billion.

In 2018, Naftogaz group remained the 

largest taxpayer in Ukraine. During the 

year, the company paid UAH 138.6 billion 

in taxes and compulsory payments to the 

budget, which is 26% more than in 2017. 

In 2018, based on the results of its activ-

ities in 2017, Naftogaz, as a legal entity, 

paid UAH 29.5 billion dividends to the 

state budget. This growth was due to an 

increase in the CIT by UAH 9.8 billion com-

pared to 2017, as a result of the growth 

of taxable income of Natfogaz as a legal 

entity, due to the recognition in 2017 of 

the income related to the SCC arbitrations 

concerning the gas transit contract. In ad-

dition, the amount of VAT paid to the state 

budget increased by UAH 8.3 billion due 

to the growth of sales revenue and the 

recognition of non-refundable VAT on the 

compensation to be received by Naftogaz 

according to the ruling of the Arbitration 

Tribunal on the gas transit contract.

Almost 72% of the assets of the group 

in 2018 are fixed assets, of which the 

most significant, in terms of cost, are 

buffer gas (42.9% of the value of the 

group's fixed assets), oil and gas assets 

(21.9% of the value of the group's fixed 

assets) and the gas transmission system 

(19.8% of the value of the group's fixed 

assets). 

The decrease in the total value of the 

fixed assets of the group in 2018 was 

mostly due to the impairment of the 

GTS assets by UAH 71.0 billion.

Current assets, as of December 31, 

2018, decreased by UAH 61.1 billion, 

mainly as a result of the recognition in 

2017 of debt, in accordance with the 

decision of the Stockholm Arbitration, 

of UAH 57.1 billion, which was settled in 

February 2018. However, in 2018, trade 

receivables for natural gas and balancing 

services grew by UAH 8.4 billion and UAH 

14 billion respectively.

In 2018, the total capital investments 

of Naftogaz group increased by 80%, 

or by UAH 13.6 billion compared to 

2017. Capital investments in natural gas 

production remain the priority for the 

group, with 81% of the total investment 

in 2018, and 80.5% in 2017. The amount 

of investment has almost doubled in 

2018 compared to 2017 due to a steady 

build-up of exploration and operating 

drilling by Ukrgasvydobuvannya. Capital 

expenditures for these works in 2018 

increased by more than UAH 5.5 billion, 

or by 93% compared to 2017. The 

amount of capital investment in natural 

gas transit, which is about 8.2% of the 

total investment, increased in 2018 by 

47% compared to 2017.

Natural gas transit

Domestic natural  

gas transmission

Natural gas storage

Other

Taxes and payments to the budget

Assets

Capital investments

The cash flow from operating activities for 

2018 was UAH 71.6 billion, which is 1.5% 

higher than for 2017.

The cash flow from investment activities 

in 2018 increased by 87.2% compared to 

2017, mainly due to increased investments 

in natural gas production development.

The cash flow from financing activities 

decreased by 2.8%. The decrease in interest 

expenses resulted from a reduction of loan 

agreement liabilities. Additionally, loan 

repayments in 2018 were less than in 2017, 

including due to prolongation of terms for 

certain obligations. However, dividends 

paid to the state budget in 2018 more than 

doubled compared to the previous year and 

amounted to UAH 29.5 billion.

Cash flow

Loan obligations as at 31 December 2018 

amounted to UAH 56.0 billion compared to 

UAH 59.3 billion as at 31 December 2017. The 

major part of loans as of December 31, 2018 

were UAH denominated, representing 44.3% 

of total group borrowing.

Loans

2017

2018

Increase in 

selling price for 

transmission 

services

Increase 

in sales of 

transmission 

services

Increase in provision 

for doubtful 

receivables related 

to balancing services

Other

changes

-0.9

+0.2

+0.2

-2.2

-0.6

-3.2

Financial result in domestic gas transmission

Taxes and compulsory payments paid by the group companies

109.9

UAH billion

138.6

UAH billion

2017

2018

VAT
Corporate income tax
Gas production royalty 

Oil production royalty 
Gas condensate production royalty 
Other royalty

Excise tax  
Other taxes
Dividends

41.4

49.7

14.1

23.9

27.7

20.2 

4.3 

6.5  

13.3

29.5

2.3

 2.2 

0.3

0.3

2.5

2.6

4.1

3.7 

Assets, UAH billion

 723.1

603.7

- 16.5%

2017

2018

Loans by currency

2017

2018

UAH

USD

EUR

59.3

UAH billion

56.0

UAH billion

21.2

24.8

26.7

17.8

11.4

13.4

18%

20%

2%

2%

7%

8%

Capital investment by type of business 

0

5

10

15

20

25

30

2018

2017

35

Capital investments

Integrated gas business

Petroleum product transportation,

refining and sale

Gas transit

Gas domestic 

transmission

Gas storage

Ukrnafta

Other

17.0

30.6

13.7

24.8

 0.4

0.5

1.7

2.5

0.1

0.3

0.1

0.2

1.0

1.5

 0.0

0.7

-------------------------------------------------------------------------------------------------------------------------------------------------------------

153

152

FINANCIAL STATEMENTS

ANNUAL REPORT 2018

2018

JOINT STOCK COMPANY  

“NATIONAL JOINT STOCK COMPANY 

“NAFTOGAZ OF UKRAINE”

Page

INDEPENDENT AUDITOR’S REPORT                                                                                                    154

CONSOLIDATED FINANCIAL STATEMENTS

Consolidated Statement of Financial Position                                                                                         158

Consolidated Statement of Profit or Loss                                                                                               159

Consolidated Statement of Comprehensive Income                                                                                   160

Consolidated Statement of Changes in Equity                                                                                          161

Consolidated Statement of Cash Flows                                                                                                 136

Notes to the Consolidated Financial Statements
1 

THE ORGANISATION AND ITS OPERATIONS                                                                                       164

2 

OPERATING ENVIRONMENT                                                                                                      165

3 

SEGMENT INFORMATION                                                                                                         168

4 

BALANCES AND TRANSACTIONS WITH RELATED PARTIES                                                                         174

5 

PROPERTY, PLANT AND EQUIPMENT                                                                                              175

6 

INVESTMENTS IN ASSOCIATES AND JOINT VENTURES                                                                             177

7 

OTHER NON-CURRENT ASSETS                                                                                                  177

8 INVENTORIES                                                                                                                     178
9 

TRADE ACCOUNTS RECEIVABLE                                                                                                   179

10  PREPAYMENTS MADE AND OTHER CURRENT ASSETS                                                                              180
11  CASH AND BANK BALANCES                                                                                                    180
12  SHARE CAPITAL                                                                                                                 181
13 BORROWINGS                                                                                                                    181
14 PROVISIONS                                                                                                                      183
15  ADVANCES RECEIVED AND OTHER CURRENT LIABILITIES                                                                         184
16  COST OF SALES                                                                                                                 185
17  OTHER OPERATING INCOME                                                                                                      185
18  OTHER OPERATING EXPENSES                                                                                                   185
19  FINANCE COSTS                                                                                                                  186
20  FINANCE INCOME                                                                                                                186
21  INCOME TAX                                                                                                                    186
22  CONTINGENCIES, COMMITMENTS AND OPERATING RISKS                                                                         187
23  FINANCIAL RISK MANAGEMENT                                                                                                 190
24  FAIR VALUE                                                                                                                       193
25  SUBSEQUENT EVENTS                                                                                                           196
26  SUMMARY OF SIGNIFICANT ACCOUNTING POLICIES                                                                             196
27  CRITICAL ACCOUNTING ESTIMATES AND JUDGEMENTS                                                                           204
28  ADOPTION OF NEW OR REVISED STANDARDS AND INTERPRETATIONS                                                            207

CONSOLIDATED FINANCIAL STATEMENTS  
AS AT AND FOR THE YEAR ENDED 31 DECEMBER 2018


2012

2013

2014

2015

2016

2017

2018

BALANCE 

SHEET

Disclaimer of 

opinion

6 qualifications 

(56% of total 

assets value)

1 qualification 

(2% of total 

assets value)

3 qualification 

(2% of total 

assets value)

3 qualifications

(2% of total 

assets value)

1 qualification 

(0.2% of total 

assets value)

no qualifica- 

tions*

PROFIT AND 

LOSS

Disclaimer of 

opinion

Disclaimer of 

opinion

6 qualifications 

(38% of net 

loss)

3 qualifications 

(9% of net loss)

3 qualifications

(53% of net 

profit)

1 qualifications

(0.3% of net 

profit)

no qualifica- 

tions*

The independent auditor did not express any qualification relating to the Naftogaz 

financial position and financial performance for 2018.   

* The only modification in the auditors’ report relates to comparability of the current year and the corresponding 

figures 

Management of the group, in cooperation with management of subsidiaries strived to minimise number of issues 
that may have an impact on the auditors' report in respect of the consolidated financial statements 

Auditor’s qualification (the qual-

ification number in the auditor’s 

report indicated in brackets)

Effect on:

Management comments

Statement of

financial position

 as at 31 December

2018

Statement of

profit or loss

2018

Matters related to prior periods that affect comparability of the current year and the corresponding figures:
Investment in joint operation:

Use of different accounting policies 

by the group and the group’s as-

sociates and joint operations;  lack 

of audited financial information of 

joint operation 

no

no

After the Final Court decision on 

termination of the agreement is 

received, the Group will deconsoli-

date this investee. 

-------------------------------------------------------------------------------------------------------------------------------------------------------------


содержание      ..     7      8      9      10     ..