FANUC Series 30i-MODEL B, 31i-MODEL B, 32i-MODEL B. MAINTENANCE MANUAL - page 5
1.DISPLAY AND OPERATION
B-64485EN/01
4
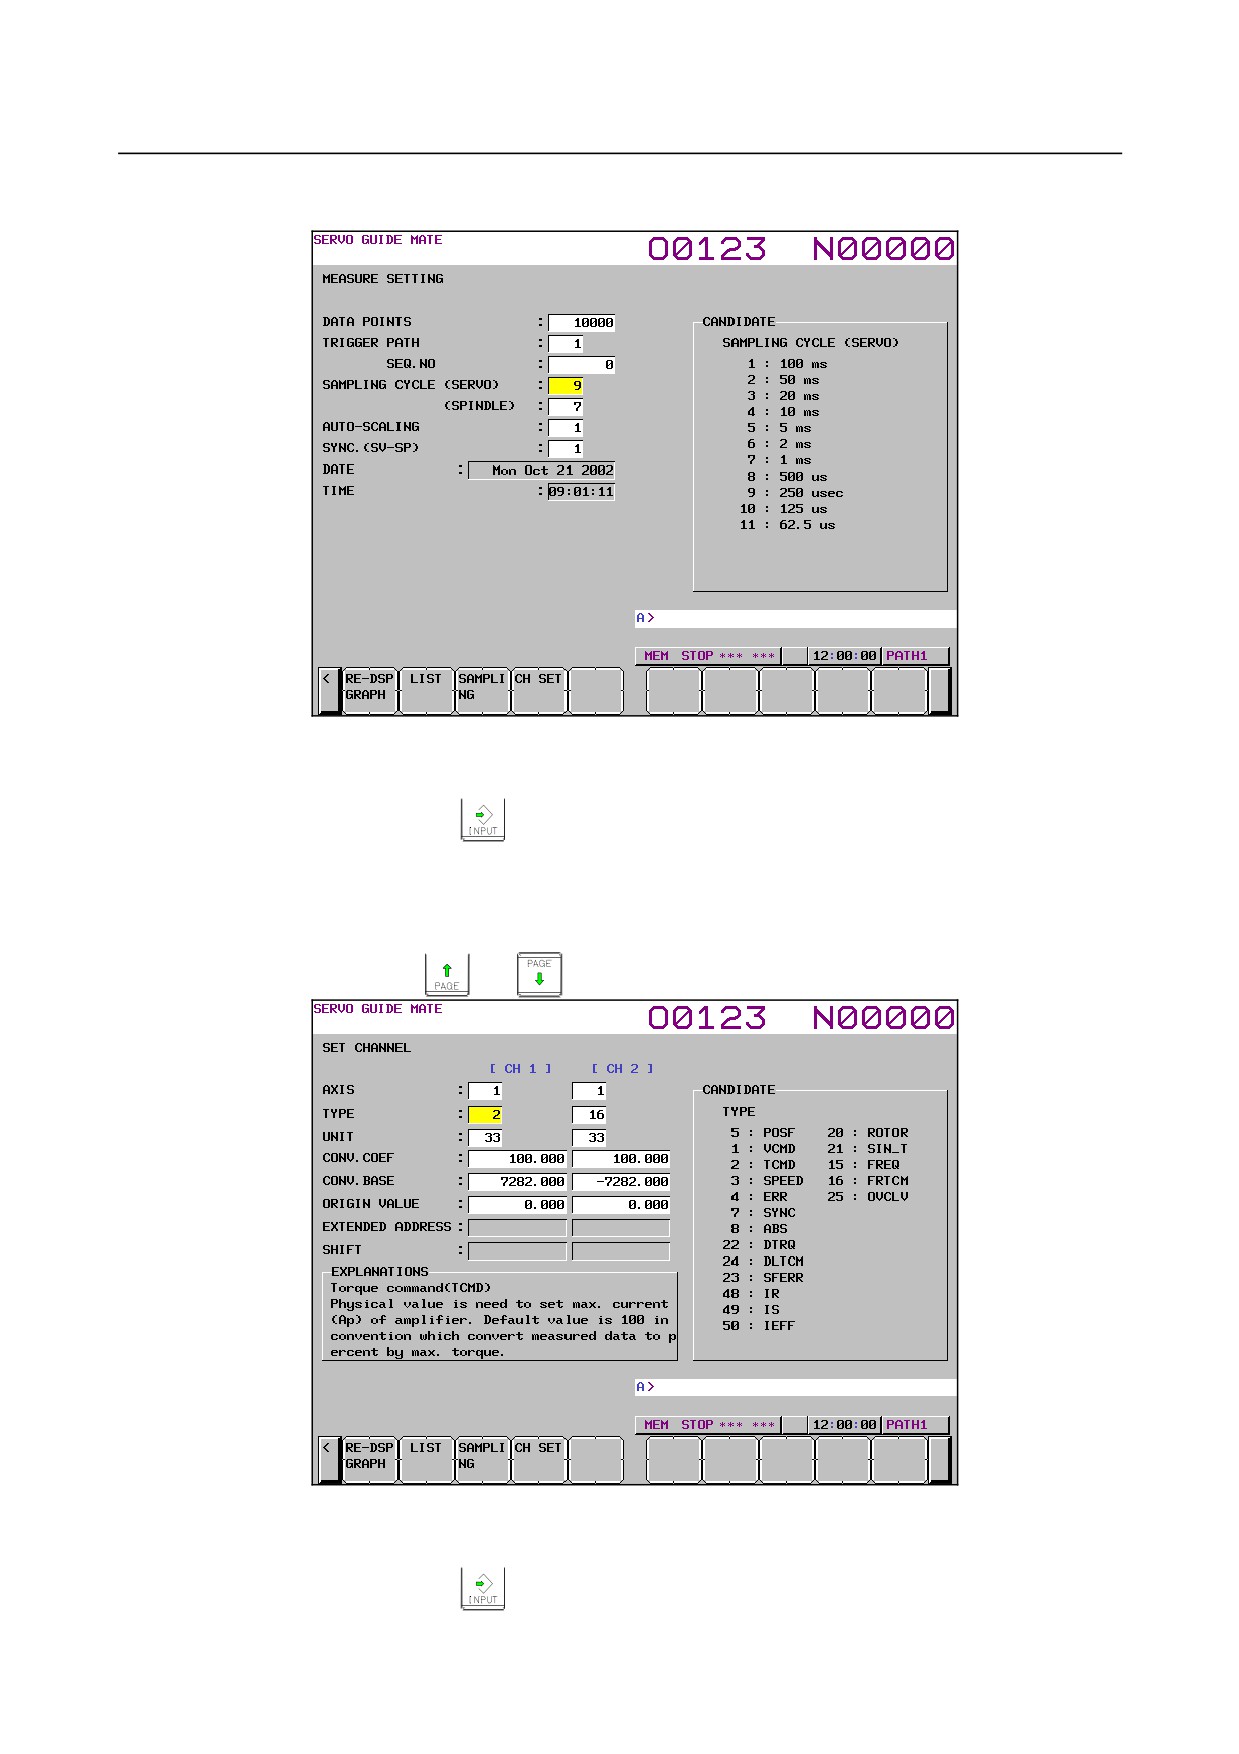
Click the soft key [SAMPLING].
The data-in screen is displayed as shown Fig. 1.9.1.2 (l).
Fig. 1.9.1.2 (l)
5
Move the cursor to the parameter you want to set, by pressing the cursor key.
6
Enter data and the press the
key.
7
Repeat steps 5 and 6 until you set all the parameters.
8
Click the soft key [SET CHANNEL].
The channel setting screen is displayed as shown Fig. 1.9.1.2 (m).
To set any channel other than the one currently displayed, display the setting screen for the desired
channel by pressing the
or
key.
Fig. 1.9.1.2 (m)
9
Move the cursor to the parameter you want to set, by pressing the cursor key.
10 Enter data and the press the
key.
11 Repeat steps 9 and 10 until you set all the parameters.
- 102 -
B-64485EN/01
1.DISPLAY AND OPERATION
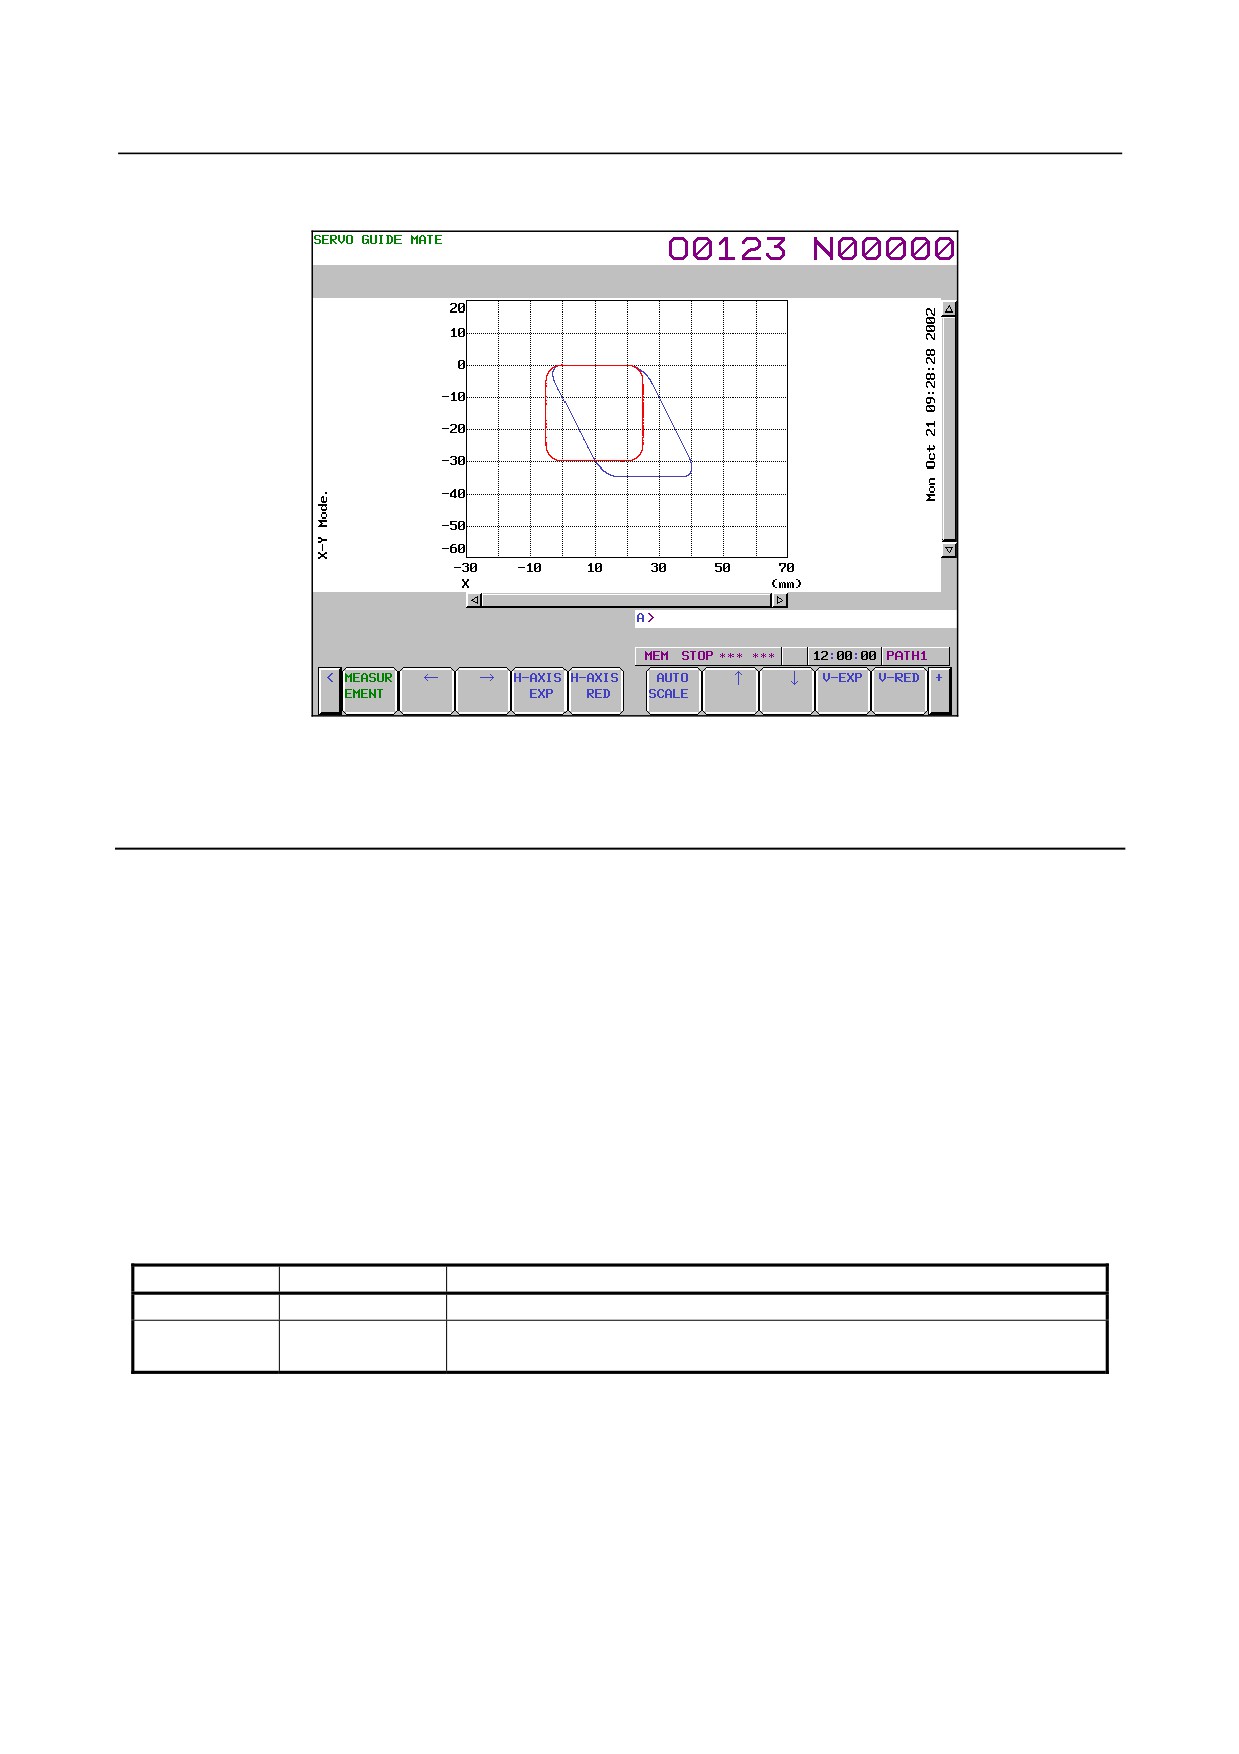
12 Click the soft key [RE-DSPGRAPH].
The wave display screen is displayed as shown Fig. 1.9.1.2 (n).
Fig. 1.9.1.2 (n)
13 The new settings will take effect next time you perform measurement. Change the operation/graph
settings and scale settings according to the new channel settings.
Explanation
-
Setting the data-in screen
See the Explanation section for the Y-time graph describing the setting of the data-in screen.
-
Setting the channel setting screen
See the Explanation section for the Y-time describing the setting of the channel setting screen.
-
Setting the operation and graph setting screen
In the operation and graph setting screen, up to two graphs can be set per draw.
• Operation
The specifiable values are as shown in Table 1.9.1.2 (a), XY graph operations.
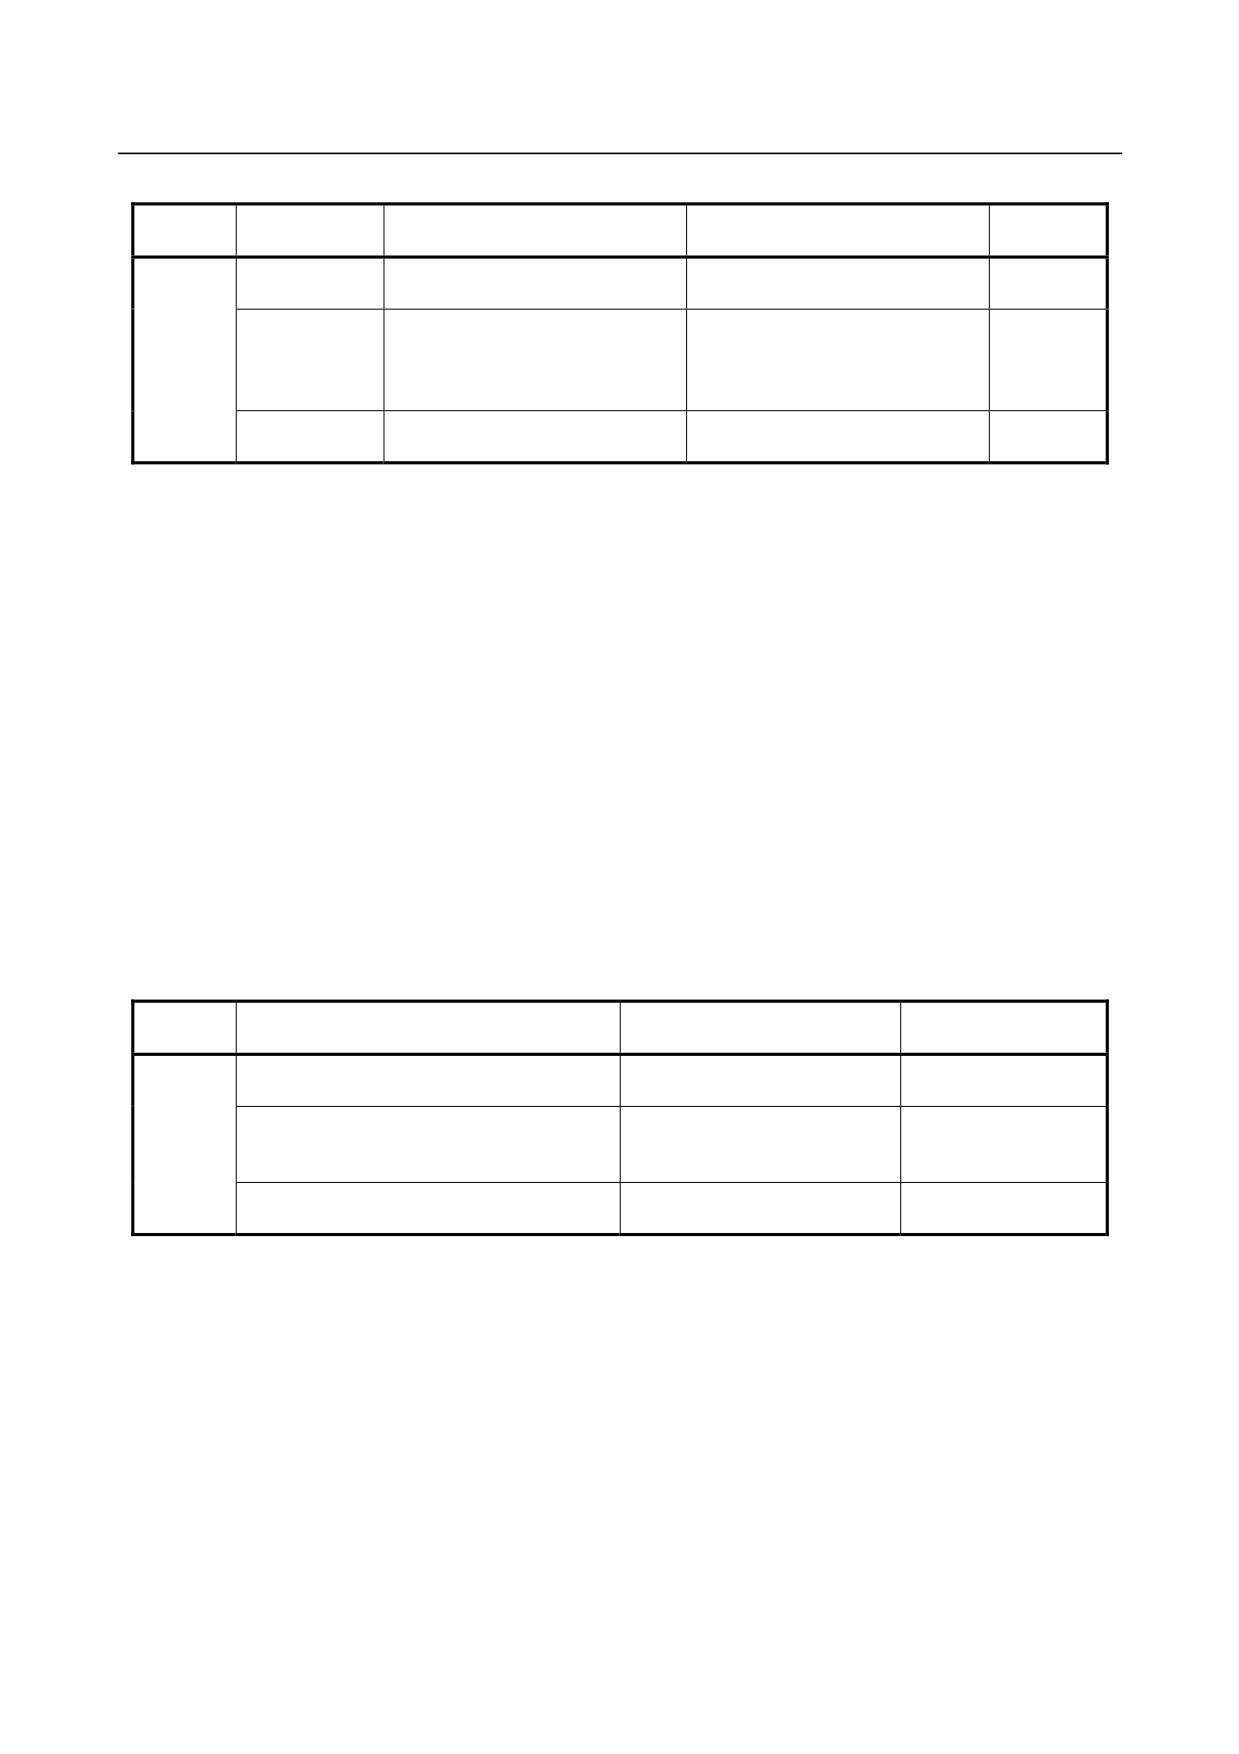
An operation cannot be specified if it does not meet the graph display conditions defined in Table
1.9.1.2 (b), XY graph conditions.
Table 1.9.1.2 (a) XY graph operations
Input value
Operation name
Description
1
N/A
Not displayed.
XY display
11
XY
Input 1 is the horizontal axis. Input 2 is the vertical axis.
- 103 -
1.DISPLAY AND OPERATION
B-64485EN/01
Table 1.9.1.2 (b) XY graph conditions
Coordinate
Operation
Input 1
Input 2
Remarks
conversion
Channel whose position has been
Channel whose position has been
1 : Normal
measured
measured
Channel whose position has been
Channel whose position has been
measured
11 : XY
2 : Polar
measured
(only when the data unit is mm, μm,
(only when the data unit is deg)
or inch)
Channel whose position has been
Channel whose position has been
3 : Angular
measured
measured
• Input 1
Specifiable values are sequential, with channel 1 being 1. The maximum value is the largest channel
number for which measurement is set during the channel setting process. A value that does not meet
the graph display conditions defined in Table 1.9.1.2 (b), XY graph conditions cannot be specified in
input 1.
• Input 2
Specifiable values are sequential, with channel 1 being 1. The maximum value is the largest channel
number for which measurement is set during the channel setting process. A value that does not meet
the graph display conditions defined in Table 1.9.1.2 (b), XY graph conditions cannot be specified in
input 2.
• Display unit
The specifiable value is 4 (mm) only.
• Coordinate conversion
Specifiable values are 1 (Normal; no coordinate conversion), 2 (Polar; coordinate conversion for
polar coordinate interpolation), and 3 (Angular; coordinate conversion for angular axis control). The
conditions for the specifiable coordinate conversion types are as shown in Table
1.9.1.2
(c),
Corresponding XY graph coordinate conversion types.
Table 1.9.1.2 (c) Corresponding XY graph coordinate conversion types
Specifiable coordinate
Operation
Input 1
Input 2
conversion
Channel whose position has
Channel whose position has been measured
1 : Normal
been measured
Channel whose position has
Channel whose position has been measured
11 : XY
been measured
2 : Polar
(only when the data unit is mm, μm, or inch)
(only when the data unit is deg)
Channel whose position has
Channel whose position has been measured
3 : Angular
been measured
• Inclination
Specify the inclination in degrees. The specified value is effective only when Angular (coordinate
conversion for angular axis control) is specified as the coordinate conversion type.
-
Setting the scale screen
• Start point
Set the center coordinates of the horizontal axis and vertical axis of the displayed data, respectively.
• Division
Set the value of one grid of the horizontal axis and vertical axis of the displayed data, respectively.
-
Operation for measurement
See the Explanation section for the Y-time graph describing the operation for measurement.
- 104 -
B-64485EN/01
1.DISPLAY AND OPERATION
Limitation
See the Limitation section for the Y-time graph.
1.9.1.3 Circle graph
This graph displays an enlarged view of the path deviation from the specified circle arising during
circular cutting.
Only one draw can be displayed.
Displaying and setting the circle graph
Procedure
The procedure for displaying the measurement data is described below.
1
Press the
function key.
2
Press the continuous menu key
several times until [SERVO GUIDE MATE] is displayed.
3
Click the soft key [SERVO GUIDE MATE].
4
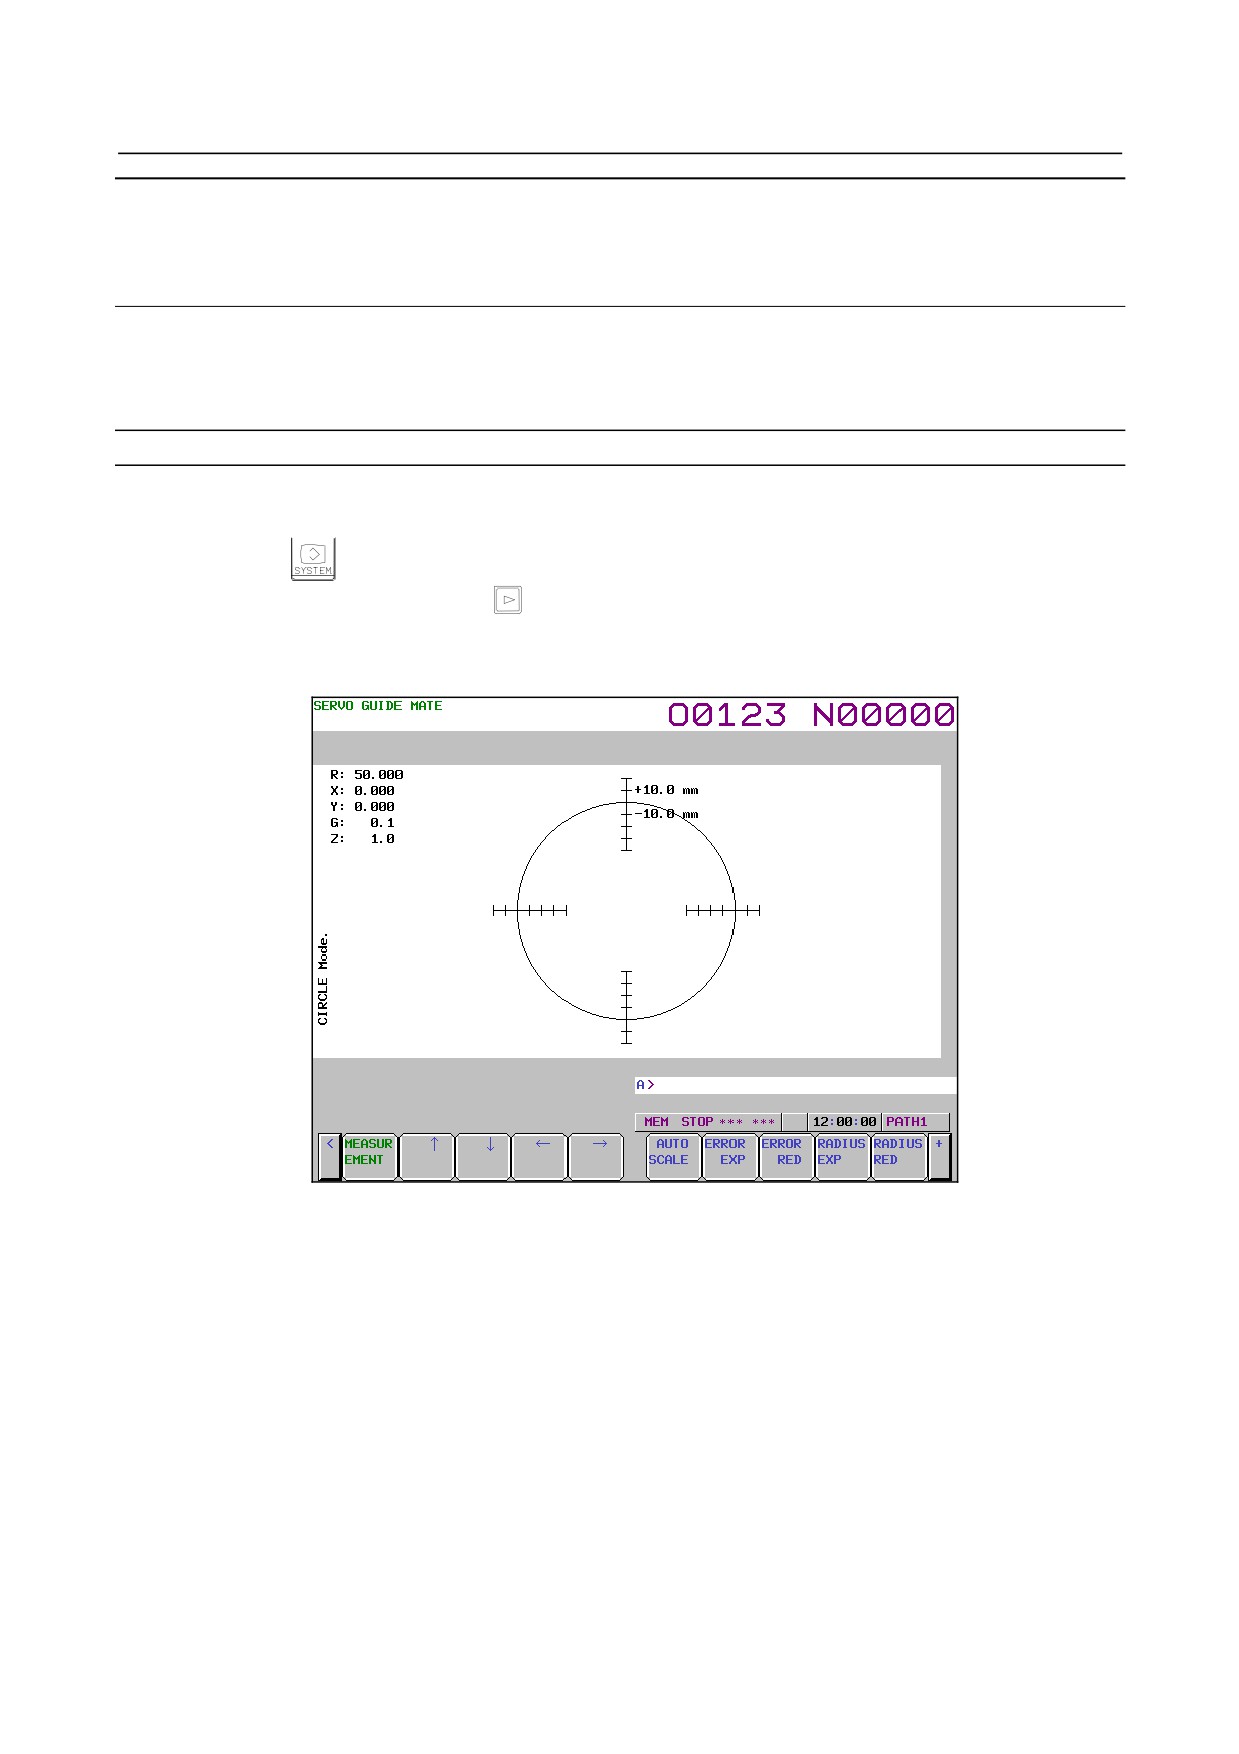
Click the soft key [CIRCLE].
The wave display screen is displayed as shown Fig. 1.9.1.3 (a).
Fig. 1.9.1.3 (a)
5
Click the soft key [MEASUREMENT].
6
Click the soft key [DATA IN].
- 105 -
1.DISPLAY AND OPERATION
B-64485EN/01
7
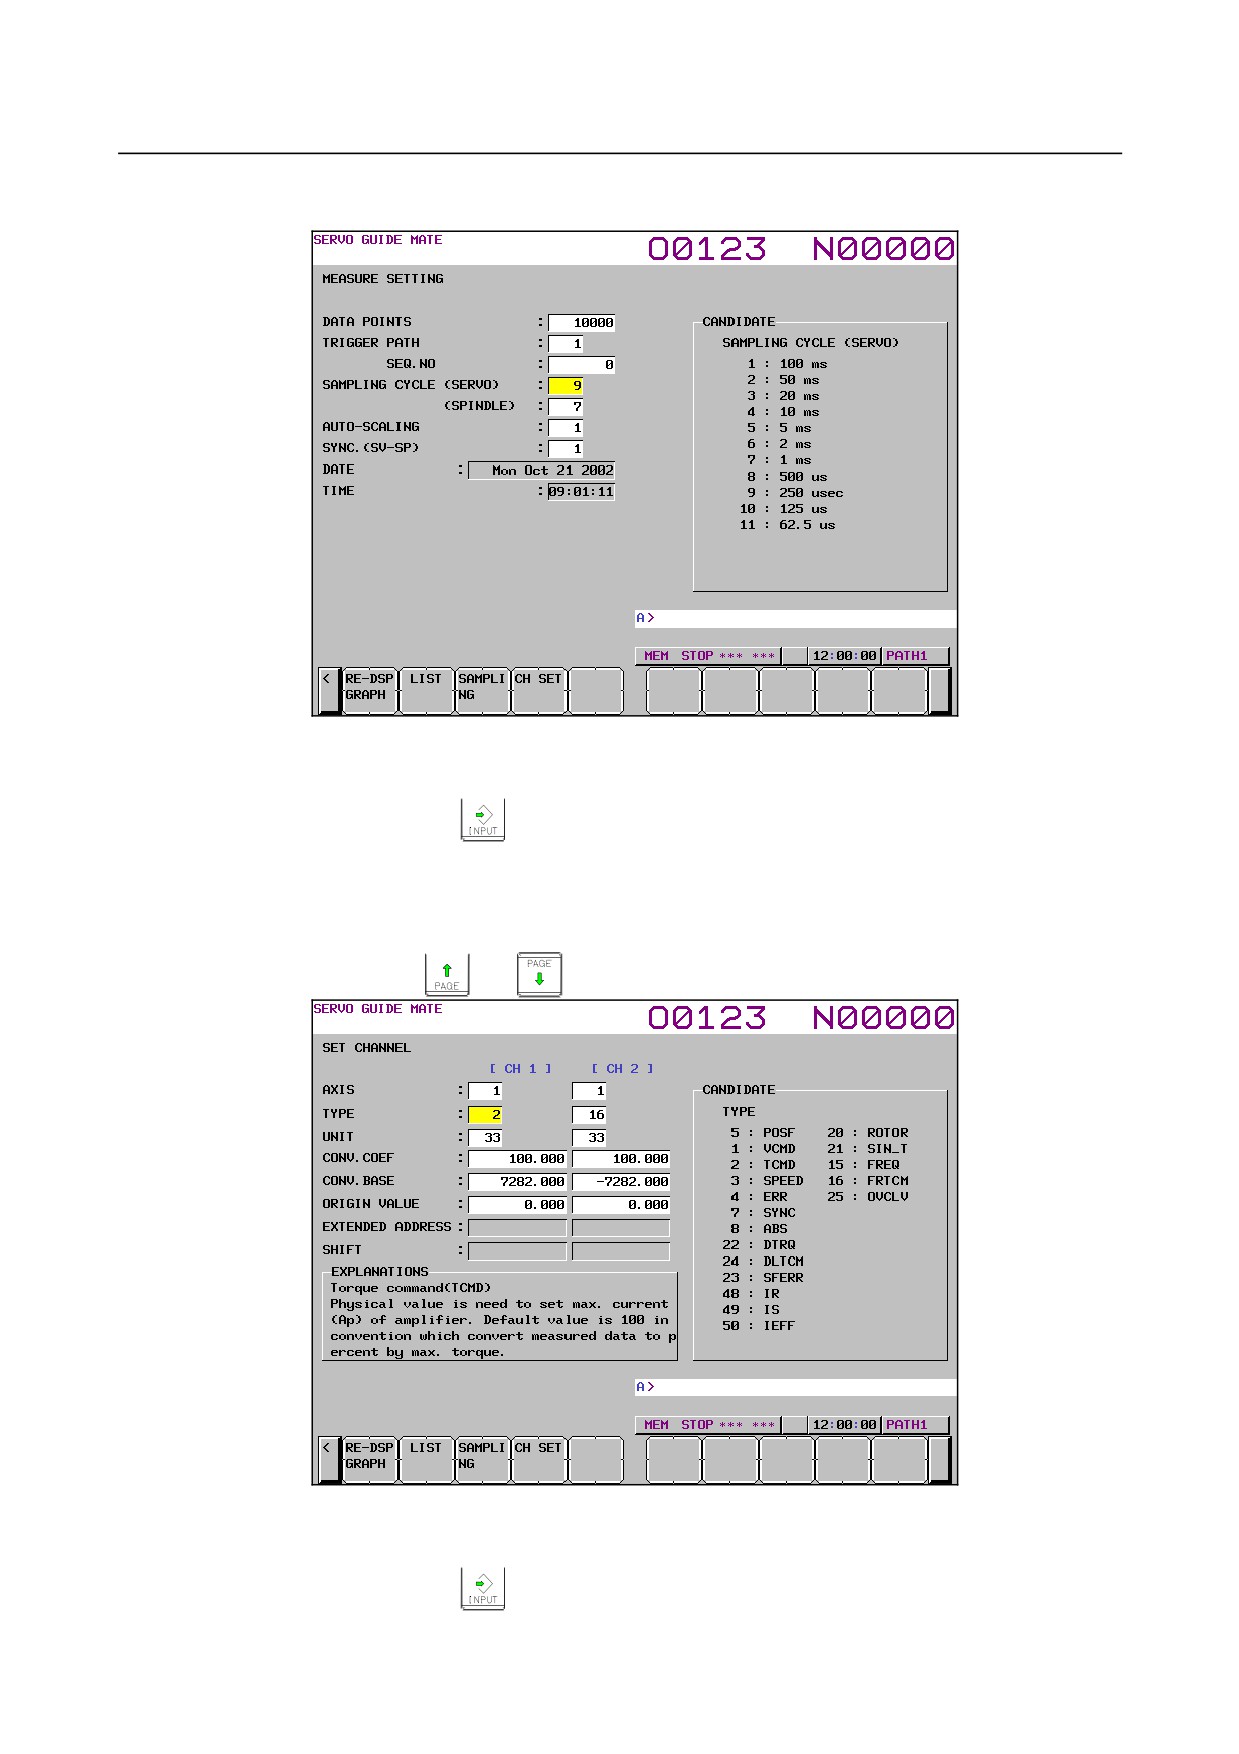
Click the soft key [SAMPLING].
The data-in screen is displayed as shown Fig. 1.9.1.3 (b).
Fig. 1.9.1.3 (b)
8
Move the cursor to the parameter you want to set, by pressing the cursor key.
9
Enter data and the press the
key.
10 Repeat steps 8 and 9 until you set all the parameters.
11 Click the soft key [SET CHANNEL].
The channel setting screen is displayed as shown Fig. 1.9.1.3 (c).
To set any channel other than the one currently displayed, display the setting screen for the desired
channel by pressing the
or
key.
Fig. 1.9.1.3 (c)
12 Move the cursor to the parameter you want to set, by pressing the cursor key.
13 Enter data and the press the
key.
14 Repeat steps 12 and 13 until you set all the parameters.
- 106 -
B-64485EN/01
1.DISPLAY AND OPERATION
15 Click the soft key [RE-DSPGRAPH].
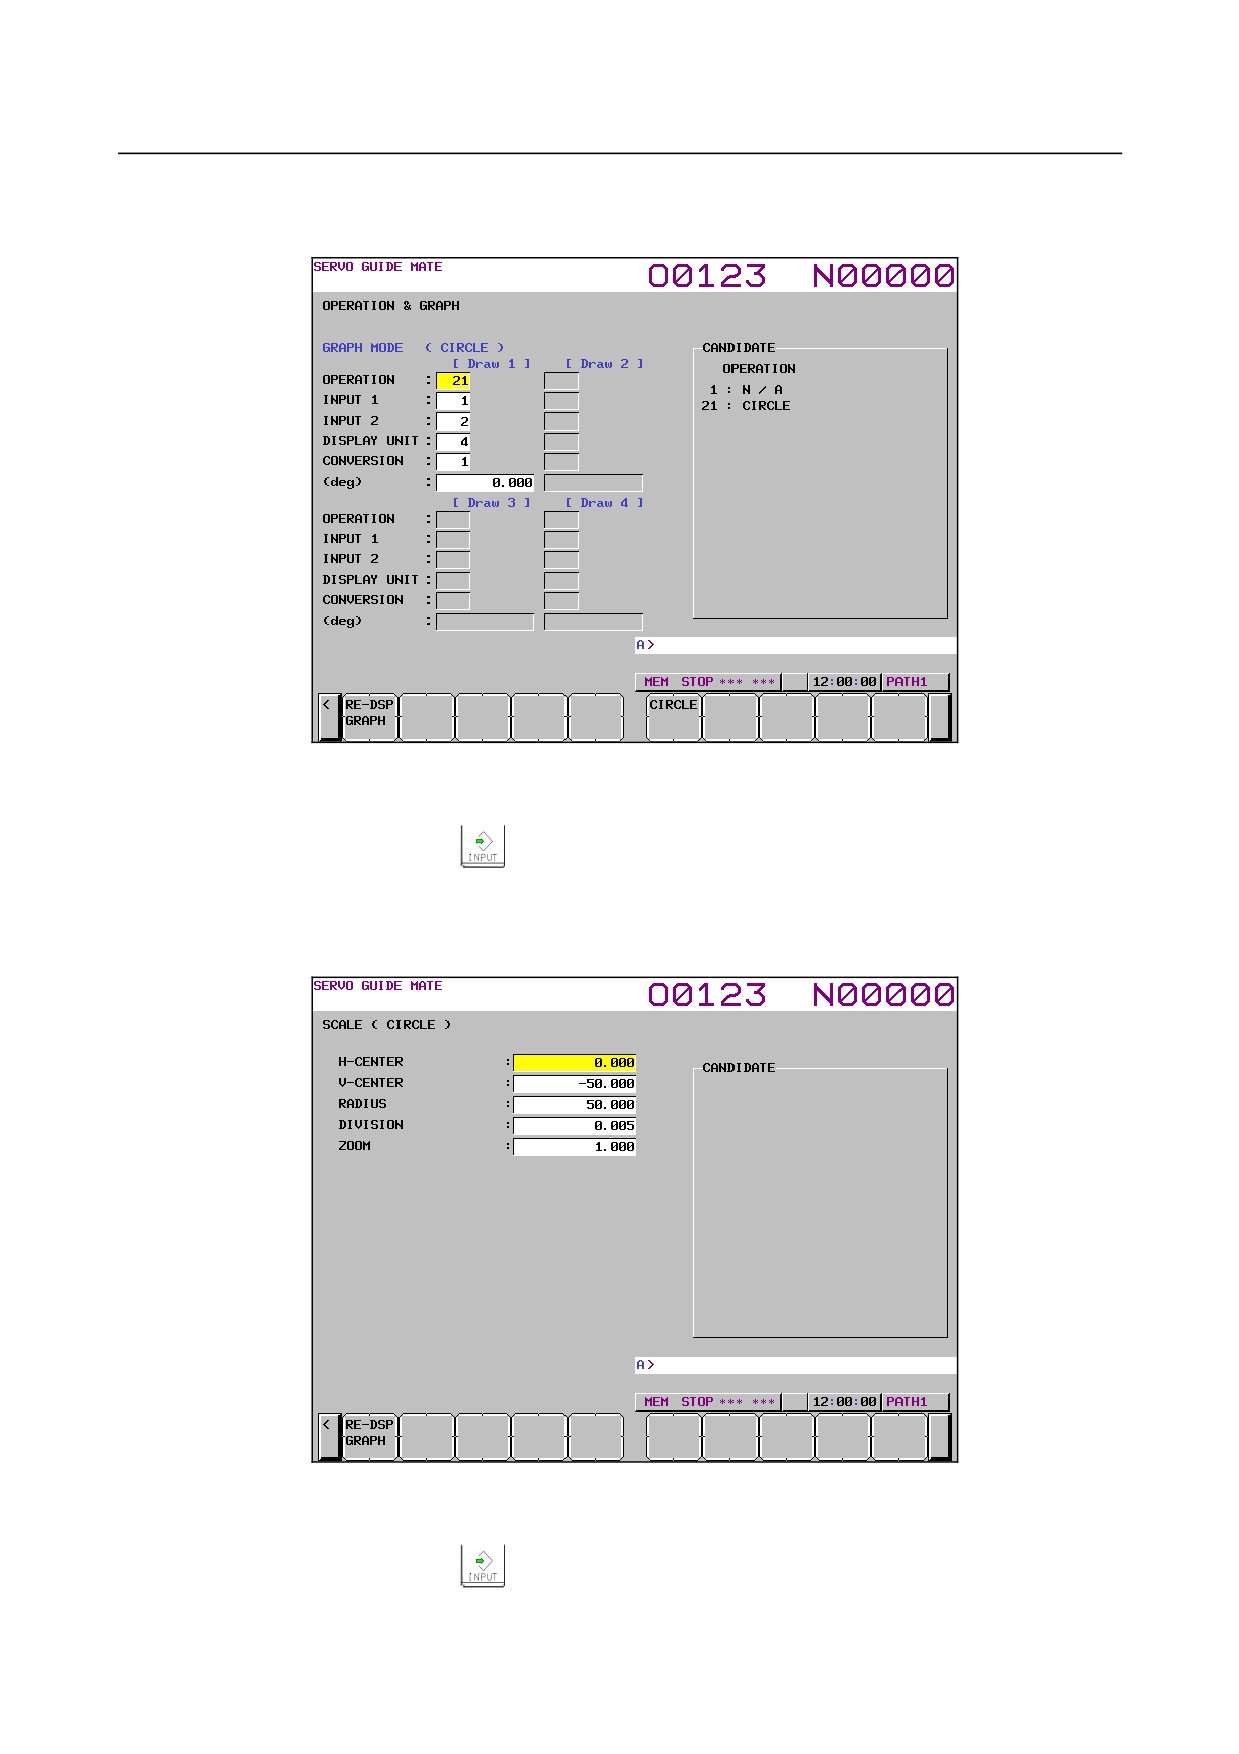
16 Click the soft key [OPERATION & GRAPH].
The operation and graph setting screen is displayed as shown Fig. 1.9.1.3 (d).
Fig. 1.9.1.3 (d)
17 Move the cursor to the parameter you want to set, by pressing the cursor key.
18 Enter data and the press the
key.
19 Repeat steps 17 and 18 until you set all the parameters.
20 Click the soft key [RE-DSPGRAPH].
21 Click the soft key [SCALE SET].
The scale setting screen is displayed as shown Fig. 1.9.1.3 (e).
Fig. 1.9.1.3 (e)
22 Move the cursor to the parameter you want to set, by pressing the cursor key.
23 Enter data and the press the
key.
24 Repeat steps 22 and 23 until you set all the parameters.
- 107 -
1.DISPLAY AND OPERATION
B-64485EN/01
25 Click the soft key [RE-DSPGRAPH].
26 Click the soft key [MEASUREMENT].
27 Click the soft key [START].
28 Start the automatic or manual operation.
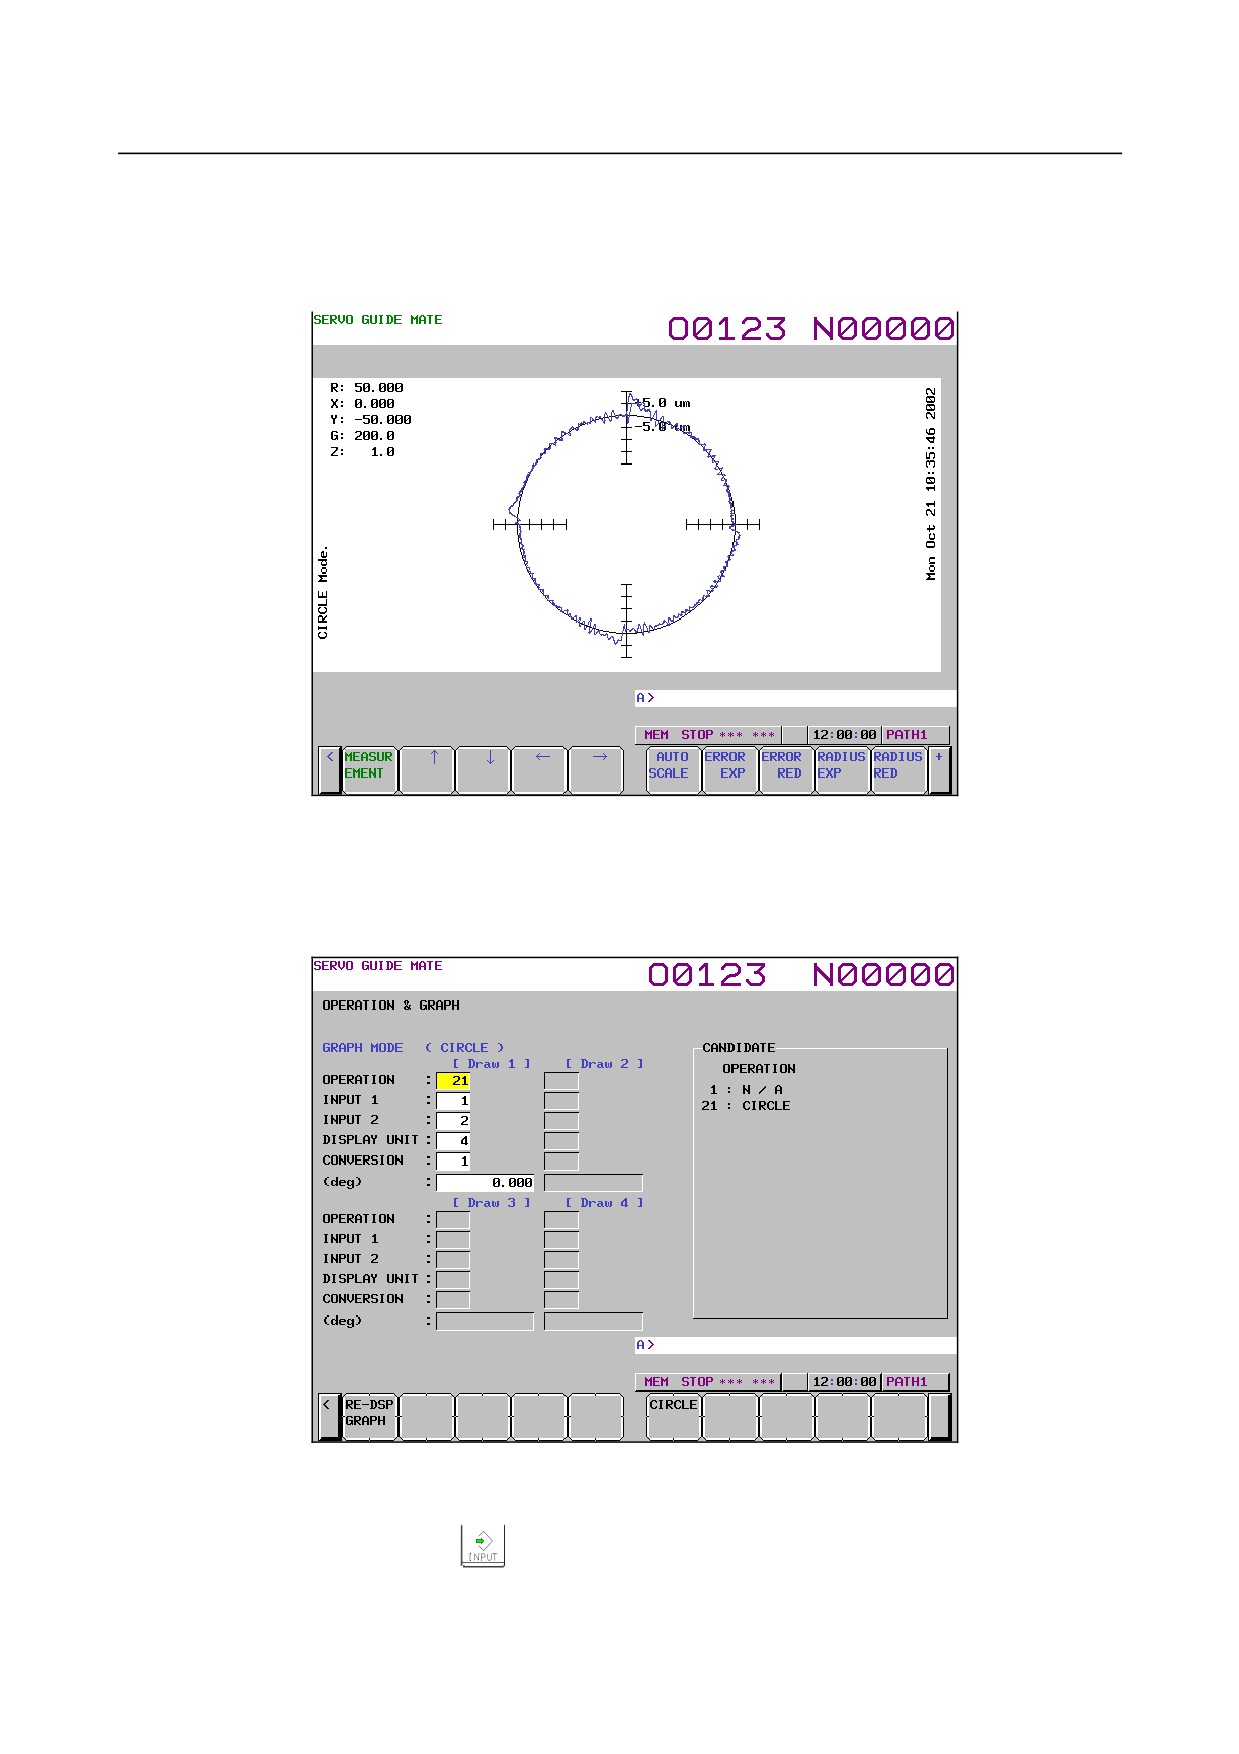
29 When the measurement is completed, the wave display screen is displayed as shown Fig. 1.9.1.3 (f).
Fig. 1.9.1.3 (f)
-
Changing the operation and graph setting screen
The procedure for changing the operation and graph setting screen as necessary is described below.
1
Click the soft key [OPERATION & GRAPH].
The operation and graph setting screen is displayed as shown Fig. 1.9.1.3 (g).
Fig. 1.9.1.3 (g)
2
Move the cursor to the parameter you want to set, by pressing the cursor key.
3
Enter data and the press the
key.
4
Repeat steps 2 and 3 until you set all the parameters.
- 108 -
B-64485EN/01
1.DISPLAY AND OPERATION
5
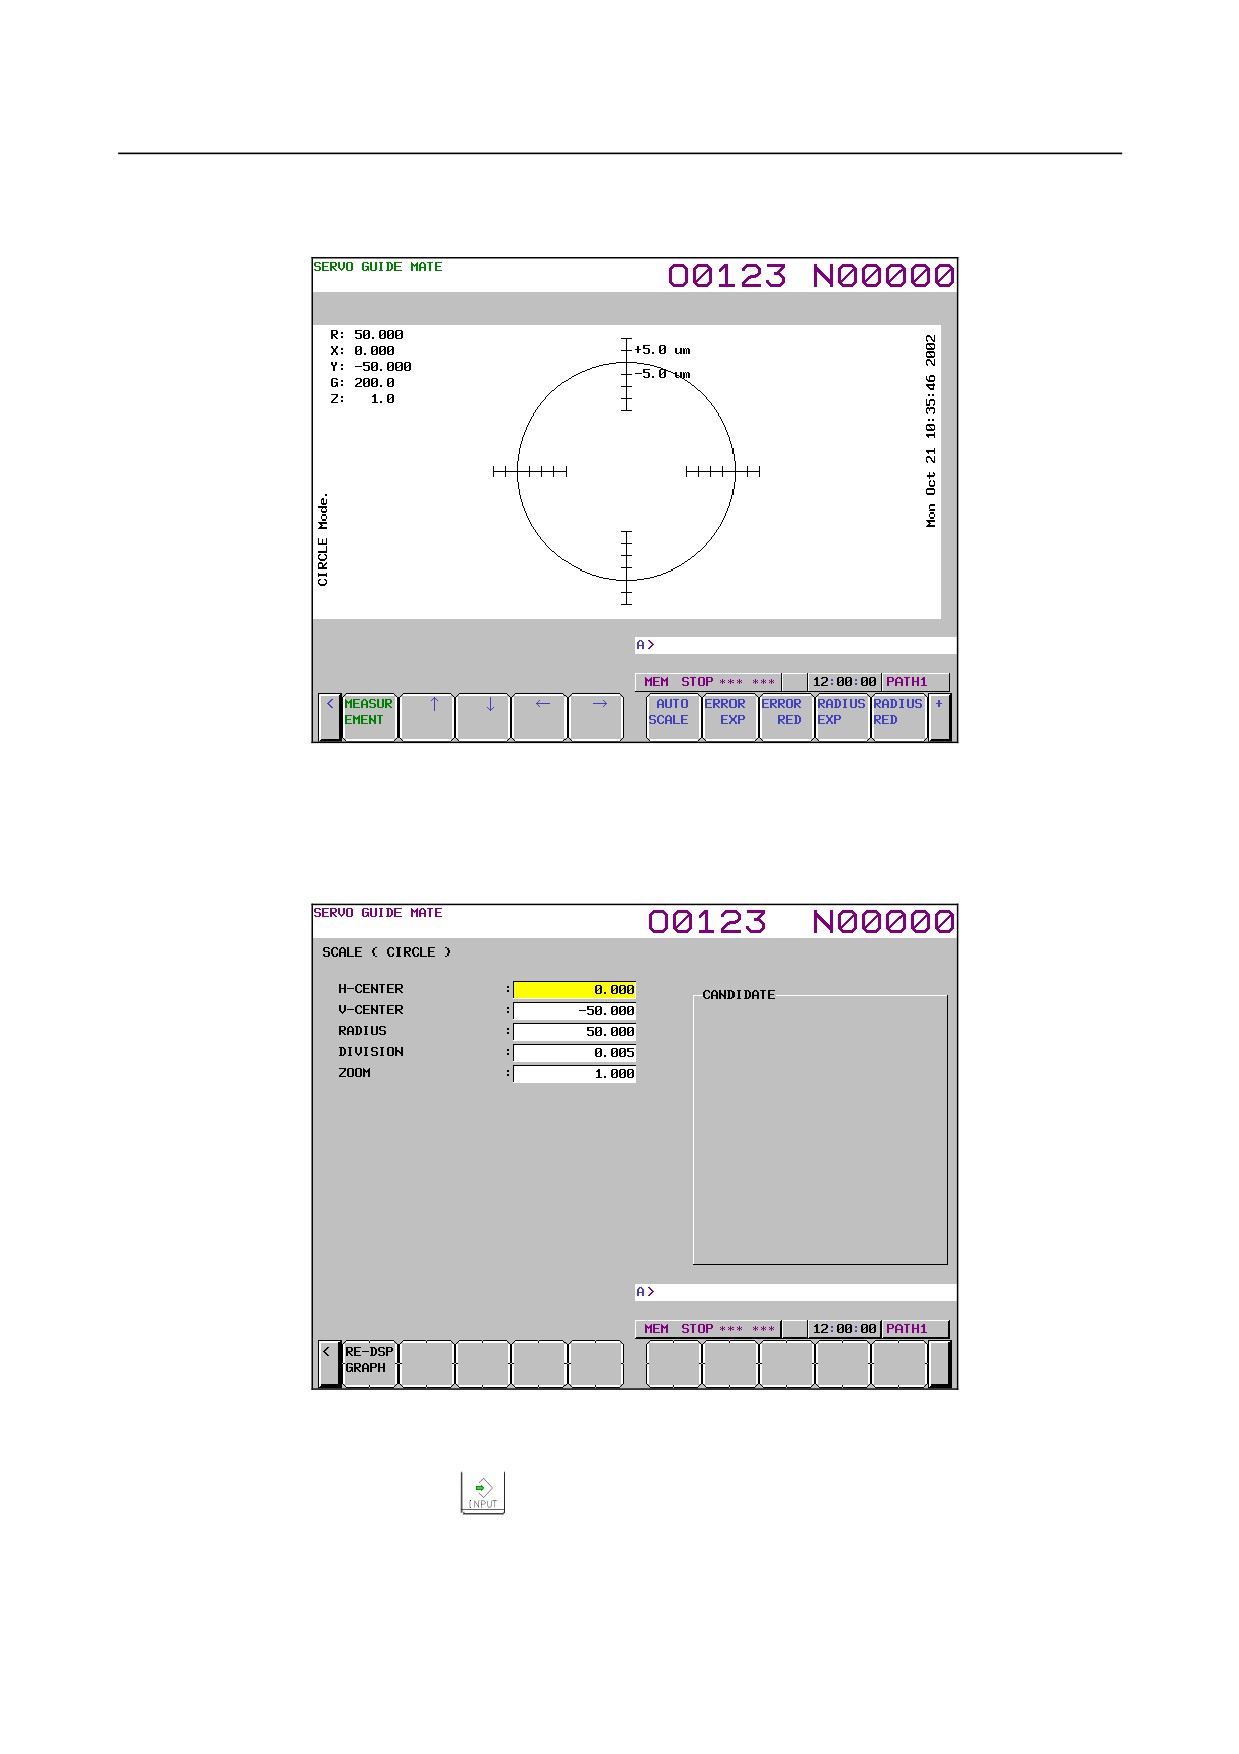
Click the soft key [RE-DSPGRAPH].
Based on the new operation and graph settings, the wave display screen is displayed as shown Fig.
1.9.1.3 (h).
Fig. 1.9.1.3 (h)
-
Changing the scale screen
The procedure for changing the scale settings as necessary is described below.
1
Click the soft key [SCALE SET].
The scale setting screen is displayed as shown Fig. 1.9.1.3 (i).
Fig. 1.9.1.3 (i)
2
Move the cursor to the parameter you want to set, by pressing the cursor key.
3
Enter data and the press the
key.
4
Repeat steps 2 and 3 until you set all the parameters.
5
Click the soft key [RE-DSPGRAPH].
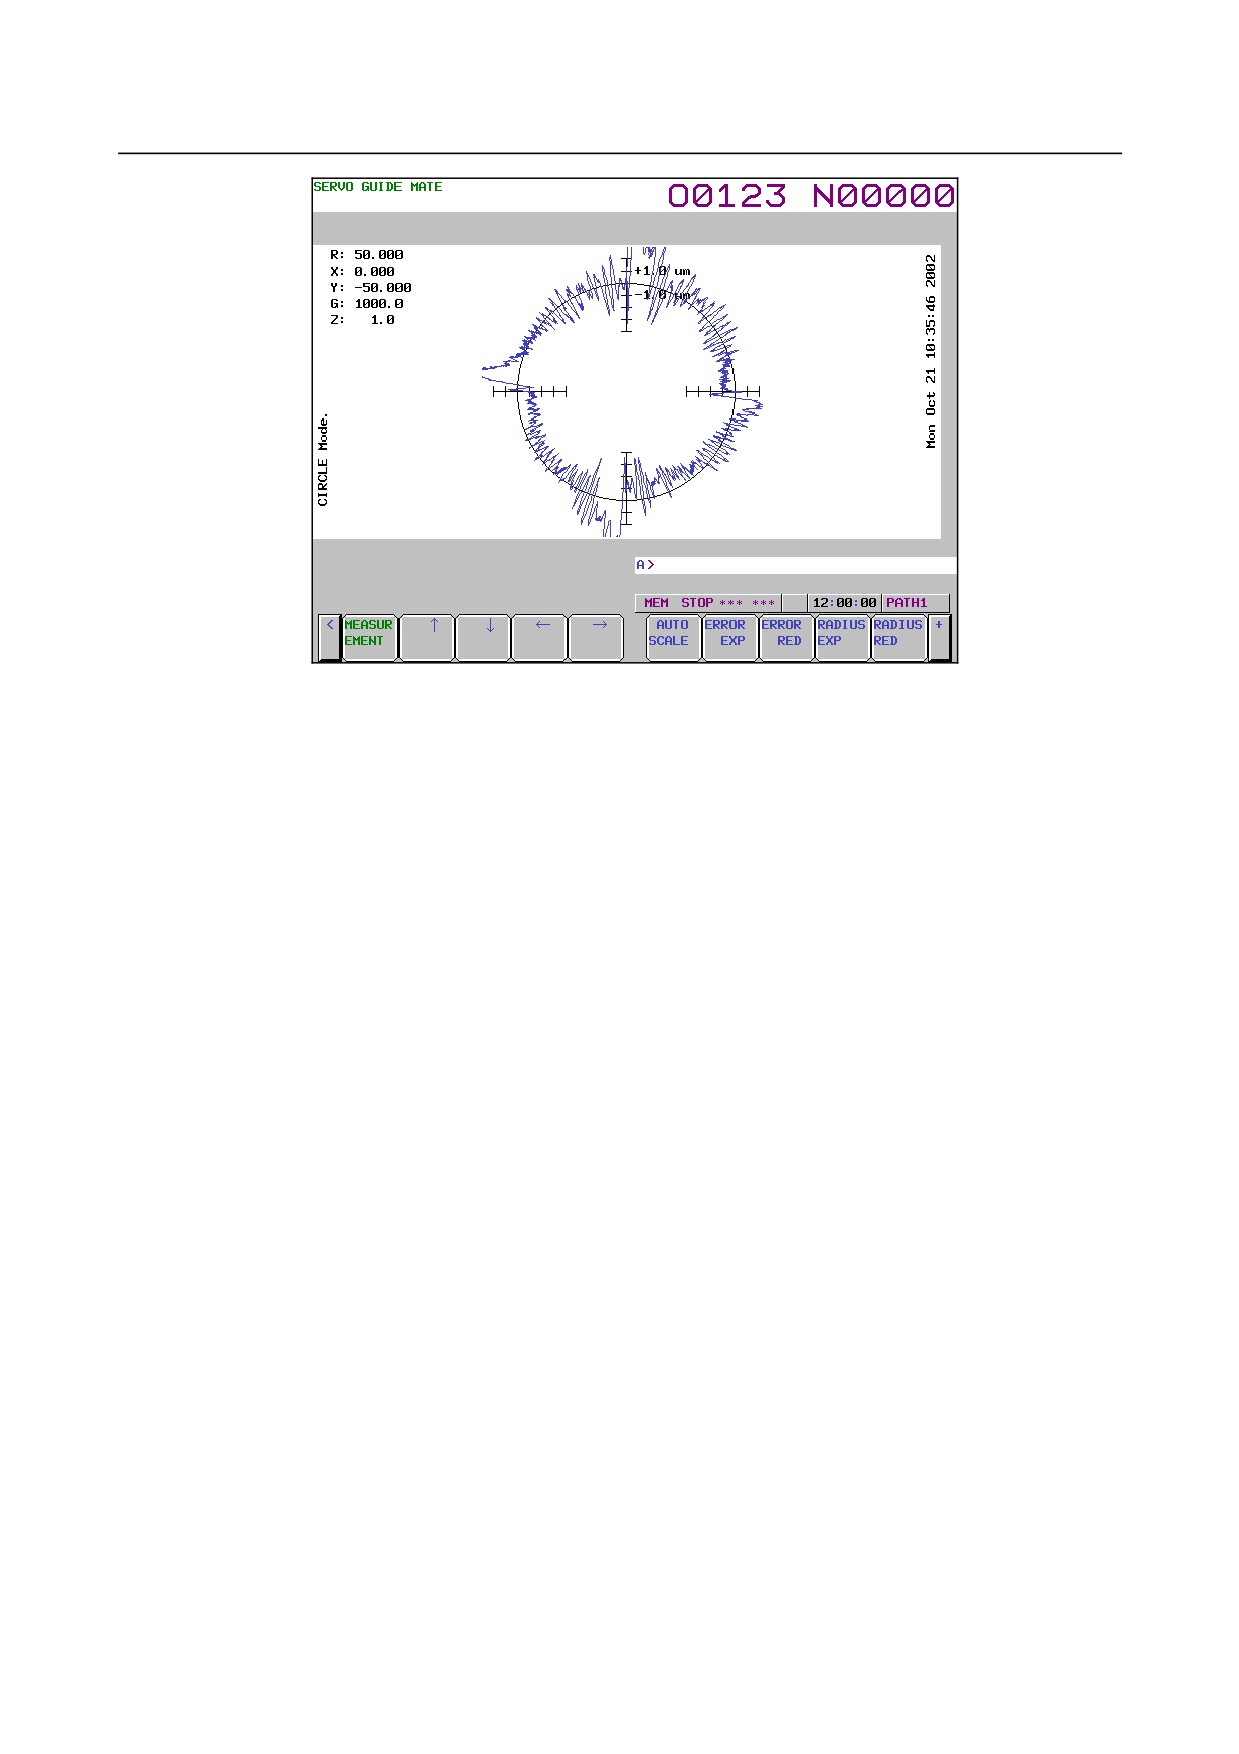
Based on the new scale settings, the wave display screen is displayed as shown Fig. 1.9.1.3 (j).
- 109 -
1.DISPLAY AND OPERATION
B-64485EN/01
Fig. 1.9.1.3 (j)
-
Manipulating the Circle graph
By clicking the following soft keys, you can perform the operations corresponding to them.
[MEASUREMENT] : Performs a measurement-related operation.
[←]
: Moves the center coordinate position to the left.
[→]
: Moves the center coordinate position to the right.
[↑]
: Moves the center coordinate position upward.
[↓]
: Moves the center coordinate position downward.
[AUTO SCALE]
: Enables auto scaling.
[ERROR EXP]
: Expands the error display.
[ERROR RED]
: Reduces the error display.
[RADIUSEXP]
: Expands the radius.
[RADIUSRED
: Reduces the radius.
[DRAW 1UNDSP]
: Sets whether or not to display Draw 1.
[ZOOM EXP]
: Expands the zoom.
[ZOOM RED]
: Reduces the zoom.
[OPE/G SET]
: Sets operations and graphs.
[SCALE SET]
: Sets scales.
[COM1 INPUT]
: Inputs comment 1.
[COM2 INPUT]
: Inputs comment 2.
[Y-TIME]
: Switches to the Y-time graph.
[XY]
: Switches to the XY graph.
[FOURIER]
: Switches to the Fourier graph.
[BODE]
: Switches to the Bode graph.
-
Performing measurement
When you click the soft key [MEASUREMENT], you can perform the operations corresponding to the
menu items that follow.
[START]
: Starts measurement.
[ORIGIN]
: Sets the origin value.
[STOP]
: Stops measurement.
[DATA IN]
: Specifies measurement-related settings.
- 110 -
B-64485EN/01
1.DISPLAY AND OPERATION
-
Changing measurement settings
1
When you click the soft key [MEASUREMENT] and then the soft key [DATA IN], you can perform
the operations corresponding to the menu items that follow.
2
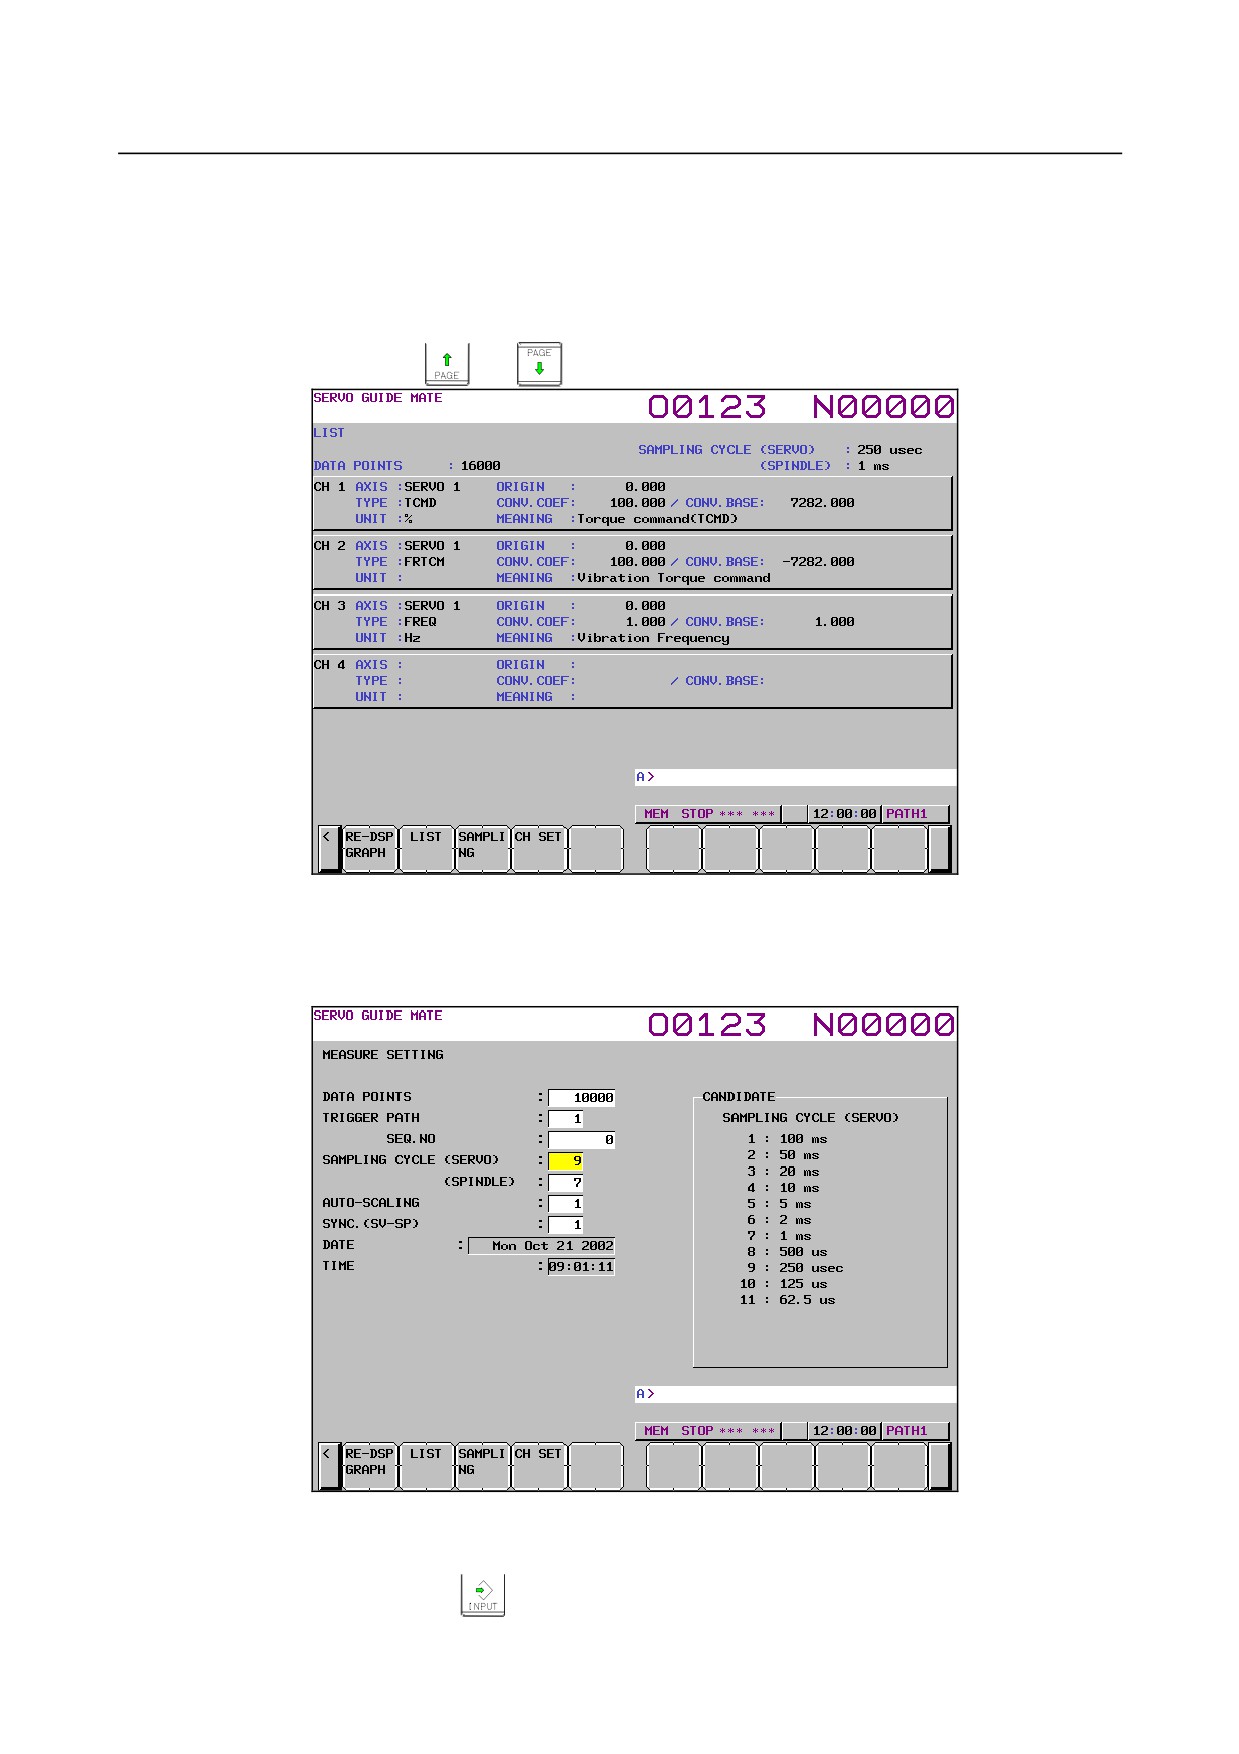
Click the soft key [LIST].
The list screen is displayed as shown Fig. 1.9.1.3 (k).
To display any channel other than the one currently displayed, display the list screen for the desired
channel by pressing the
or
key.
Fig. 1.9.1.3 (k)
3
Check the current settings on the list screen.
4
Click the soft key [SAMPLING].
The data-in screen is displayed as shown Fig. 1.9.1.3 (l).
Fig. 1.9.1.3 (l)
5
Move the cursor to the parameter you want to set, by pressing the cursor key.
6
Enter data and the press the
key.
- 111 -
1.DISPLAY AND OPERATION
B-64485EN/01
7
Repeat steps 5 and 6 until you set all the parameters.
8
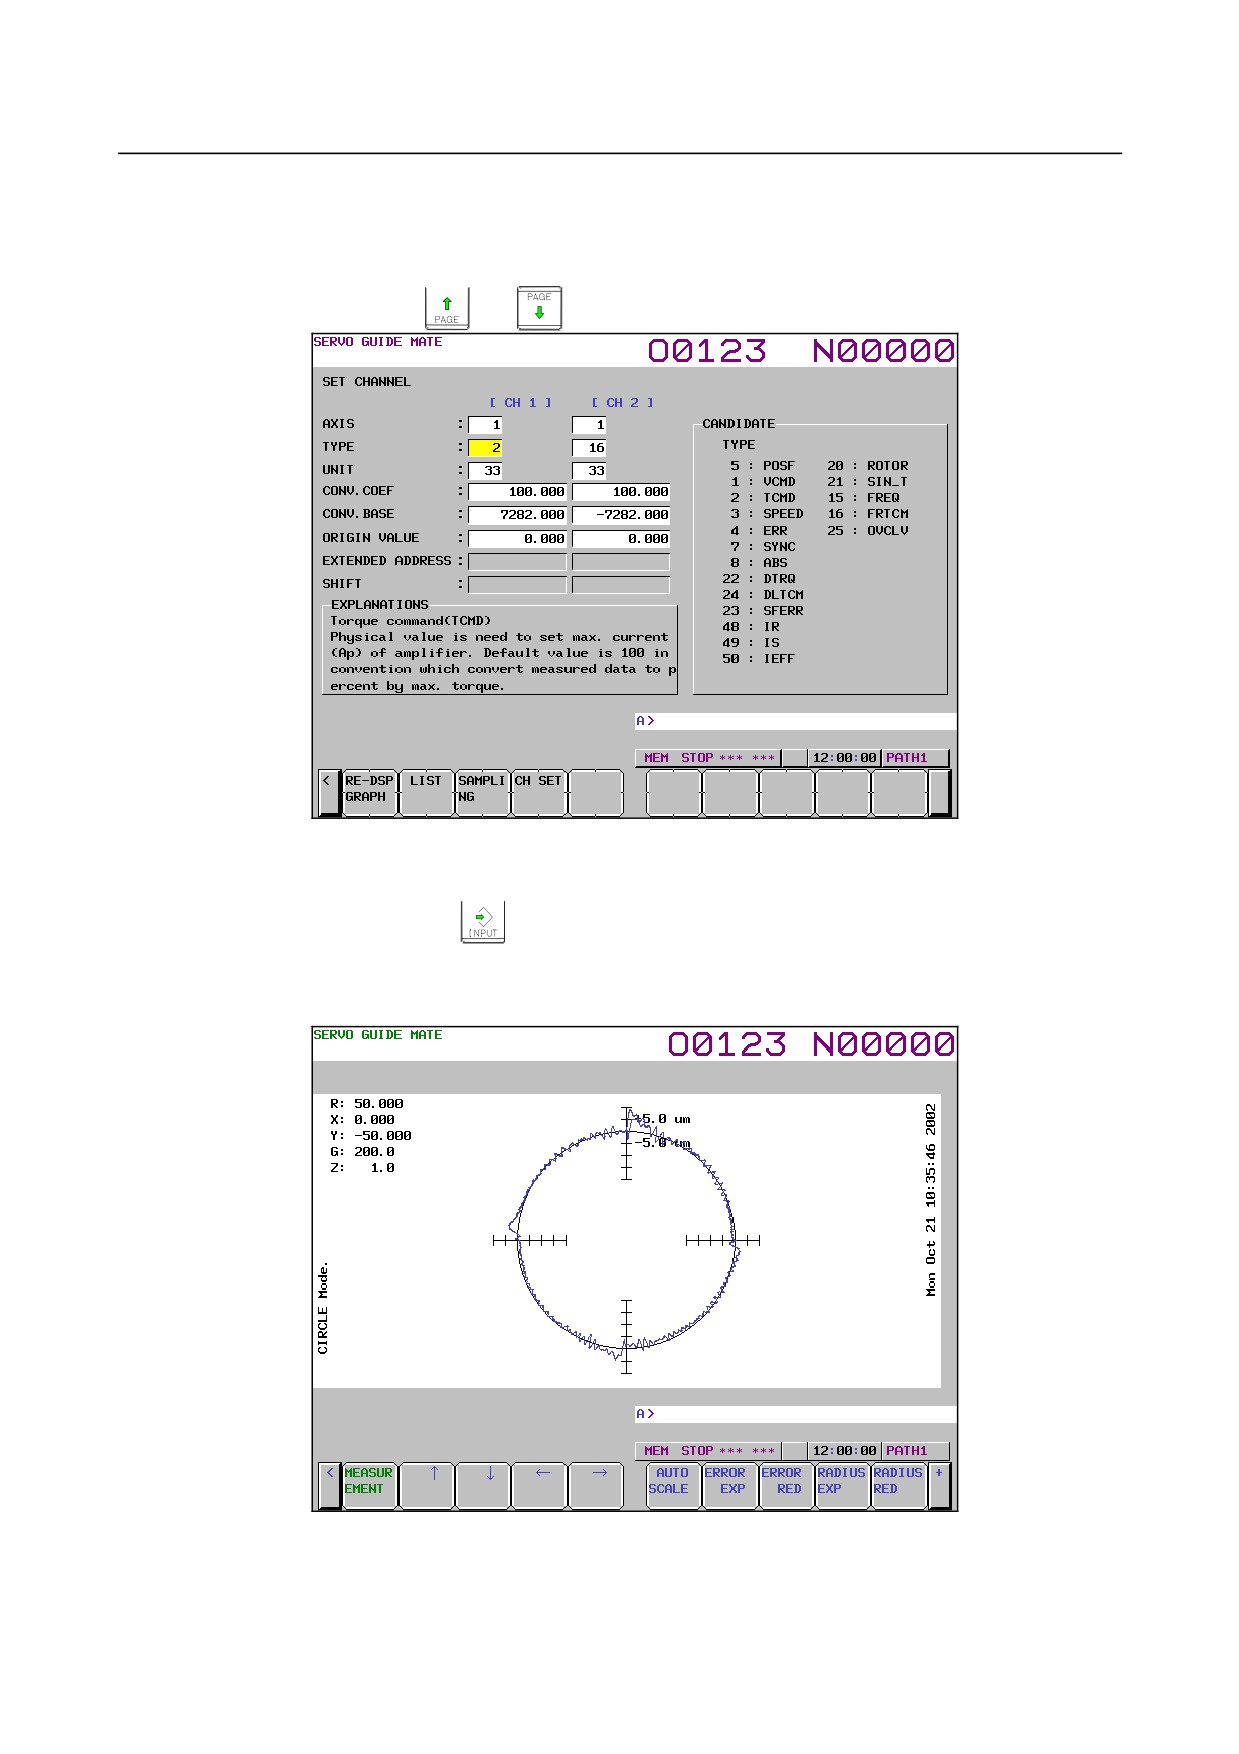
Click the soft key [SET CHANNEL].
The channel setting screen is displayed as shown Fig. 1.9.1.3 (m).
To set any channel other than the one currently displayed, display the setting screen for the desired
channel by pressing the
or
key.
Fig. 1.9.1.3 (m)
9
Move the cursor to the parameter you want to set, by pressing the cursor key.
10 Enter data and the press the
key.
11 Repeat steps 9 and 10 until you set all the parameters.
12 Click the soft key [RE-DSPGRAPH].
The wave display screen is displayed as shown Fig. 1.9.1.3 (n).
Fig. 1.9.1.3 (n)
13 The new settings will take effect next time you perform measurement. Change the operation/graph
settings and scale settings according to the new channel settings.
- 112 -
B-64485EN/01
1.DISPLAY AND OPERATION
Explanation
-
Setting the data-in screen
See the Explanation section for the Y-time graph describing the setting of the data-in screen.
-
Setting the channel setting screen
See the Explanation section for the Y-time describing the setting of the channel setting screen.
-
Setting the operation and graph setting screen
The operation and graph setting screen lets you specify graph settings.
• Operation
The specifiable values are as shown in Table 1.9.1.3 (a), Circle graph operations.
An operation cannot be specified if it does not meet the graph display conditions defined in Table
1.9.1.3 (b), Circle graph conditions.
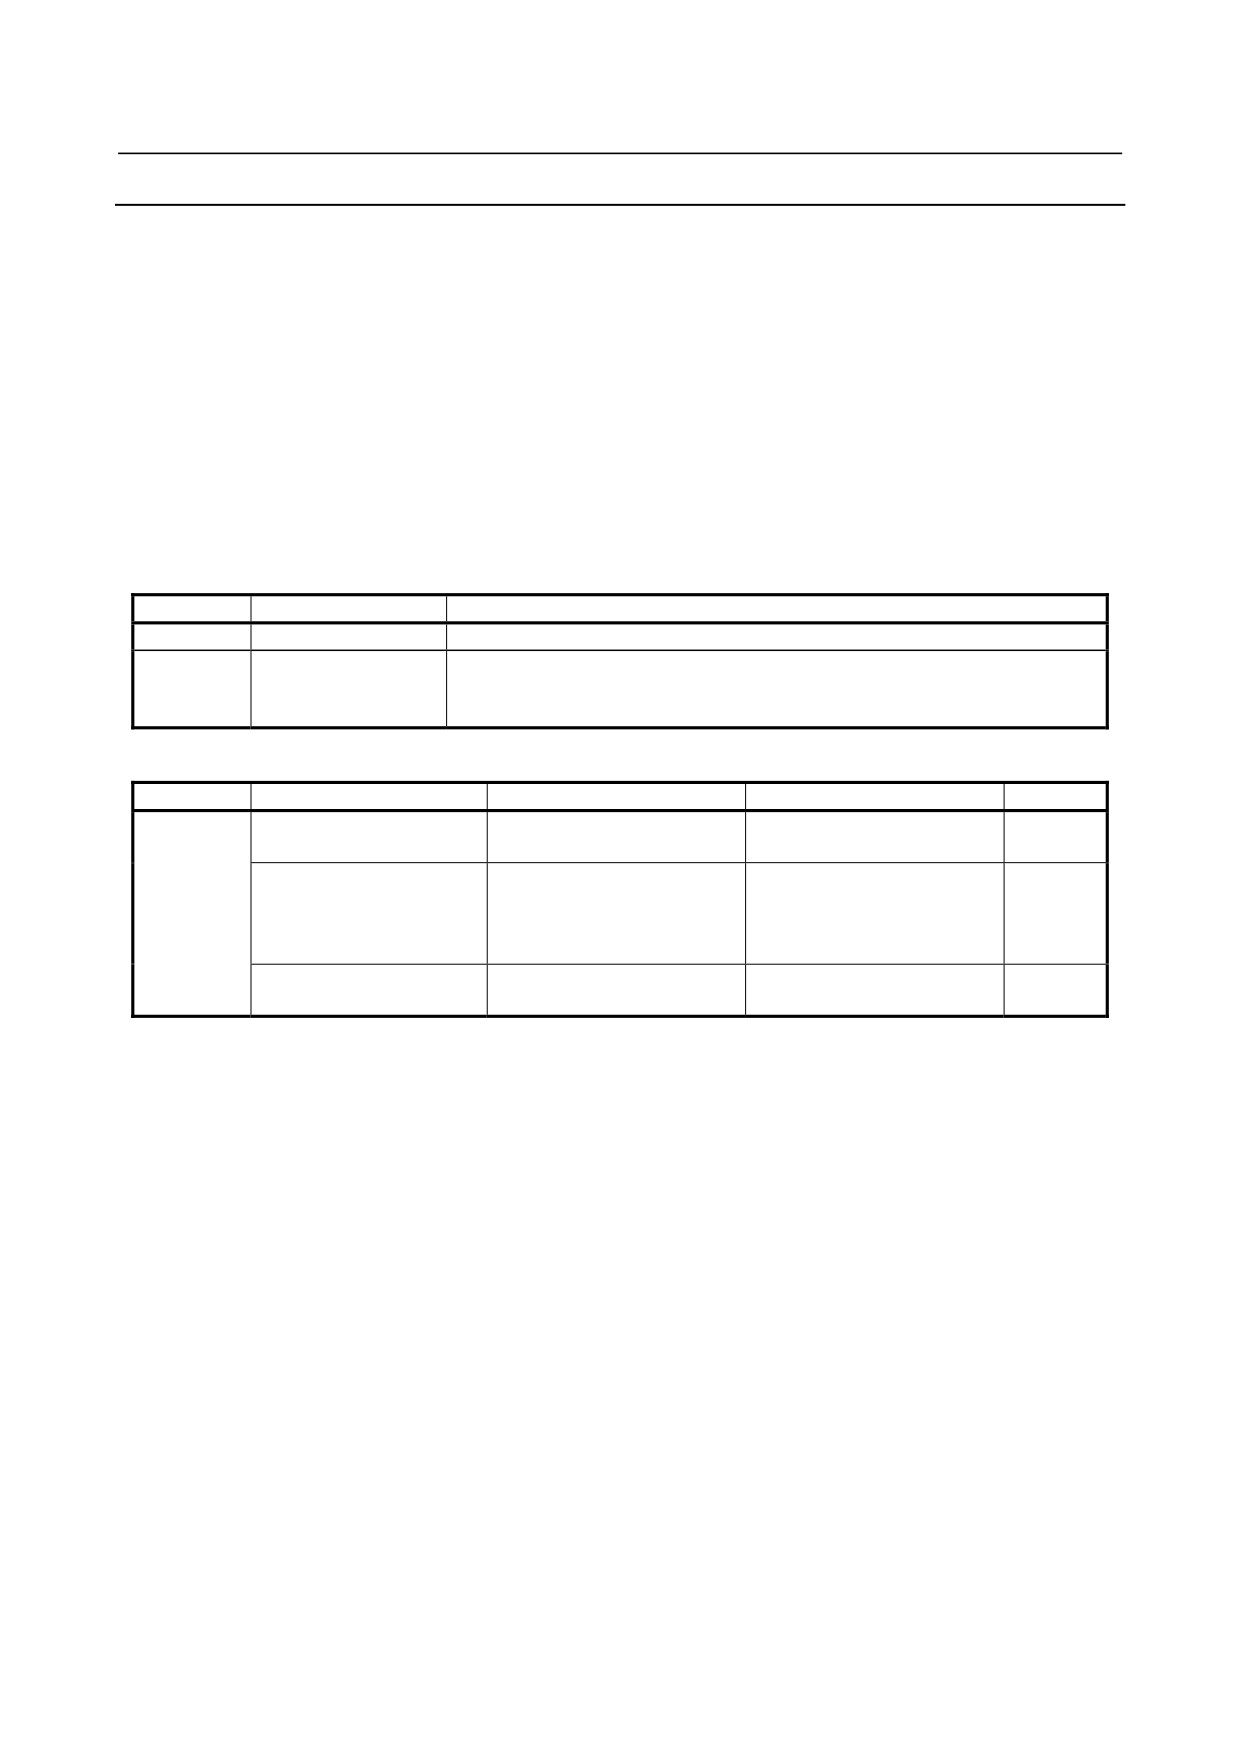
Table 1.9.1.3 (a) Circle graph operations
Input value
Operation name
Description
1
N/A
Not displayed.
Circle error display
21
Circle
Input 1 is the horizontal axis, and input 2 is the vertical axis.
The reference circle used to calculate the error is set on the scale page.
Table 1.9.1.3 (b) Circle graph conditions
Operation
Coordinate conversion
Input 1
Input 2
Remarks
Channel whose position has
Channel whose position has
1 : Normal
been measured
been measured
Channel whose position has
Channel whose position has
been measured
been measured
21 : Circle
2 : Polar
(only when the data unit is
(only when the data unit is
mm, μm, or inch)
deg)
Channel whose position has
Channel whose position has
3 : Angular
been measured
been measured
• Input 1
Specifiable values are sequential, with channel 1 being 1. The maximum value is the largest channel
number for which measurement is set during the channel setting process. A value that does not meet
the graph display conditions defined in Table 1.9.1.3 (b), Circle graph conditions cannot be specified
in input 1.
• Input 2
Specifiable values are sequential, with channel 1 being 1. The maximum value is the largest channel
number for which measurement is set during the channel setting process. A value that does not meet
the graph display conditions defined in Table 1.9.1.3 (b), Circle graph conditions cannot be specified
in input 2.
• Display unit
The specifiable value is 4 (mm) only.
• Coordinate conversion
Specifiable values are 1 (Normal; no coordinate conversion), 2 (Polar; coordinate conversion for
polar coordinate interpolation), and 3 (Angular; coordinate conversion for angular axis control). The
conditions for the specifiable coordinate conversion types are as shown in Table
1.9.1.3
(c),
Corresponding Circle graph coordinate conversion types.
- 113 -
1.DISPLAY AND OPERATION
B-64485EN/01
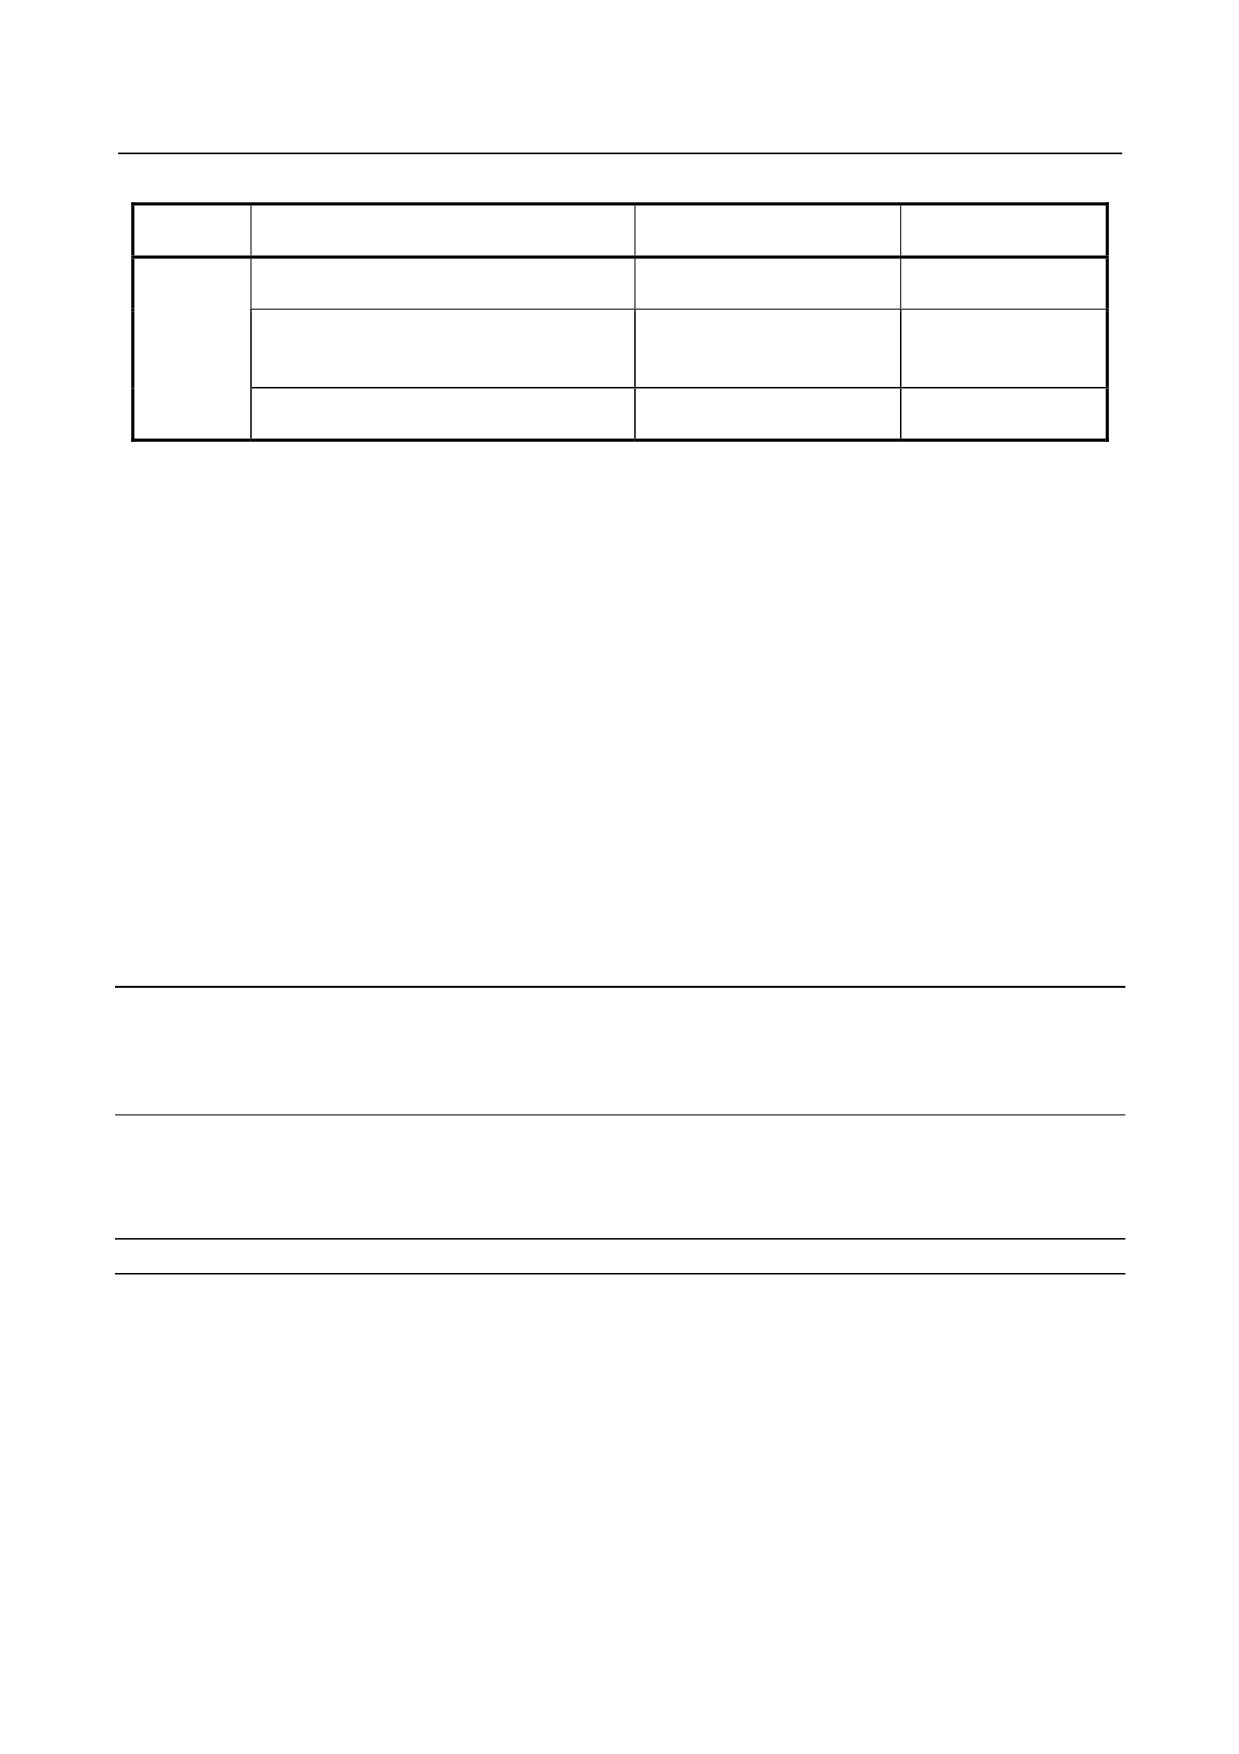
Table 1.9.1.3 (c) Corresponding Circle graph coordinate conversion types
Specifiable coordinate
Operation
Input 1
Input 2
conversion
Channel whose position has
Channel whose position has been measured
1 : Normal
been measured
Channel whose position has
Channel whose position has been measured
21 : Circle
been measured
2 : Polar
(only when the data unit is mm, μm, or inch)
(only when the data unit is deg)
Channel whose position has
Channel whose position has been measured
3 : Angular
been measured
• Inclination
Specify the inclination in degrees. The specified value is effective only when Angular (coordinate
conversion for angular axis control) is specified as the coordinate conversion type.
-
Setting the scale screen
• Center
Set the center coordinates of the circle (respective coordinates of the horizontal and vertical axes).
• Radius
Set the radius of the circle.
• Division
Set the scale of the circle display.
• Zoom
Set the zoom percentage when expanding the display in the direction of the center angle at the
quadrant change point (direction change point for each axis). This is effective for getting a detailed
view of quadrant protrusions. Under normal circumstances, set this value to 1.0.
-
Performing measurement
See the Explanation section for the Y-time graph describing the performing measurement.
Limitation
See the Limitation section for the Y-time graph.
1.9.1.4 Fourier graph
This graph displays the frequency spectrum by performing digital Fourier conversion for the range of data
displayed by the Y-time graph.
Up to four draws can be displayed at a time.
Displaying and setting the Fourier graph
Procedure
The procedure for displaying the measurement data is described below.
1
Display the Y-time graph according to the relevant procedure.
2
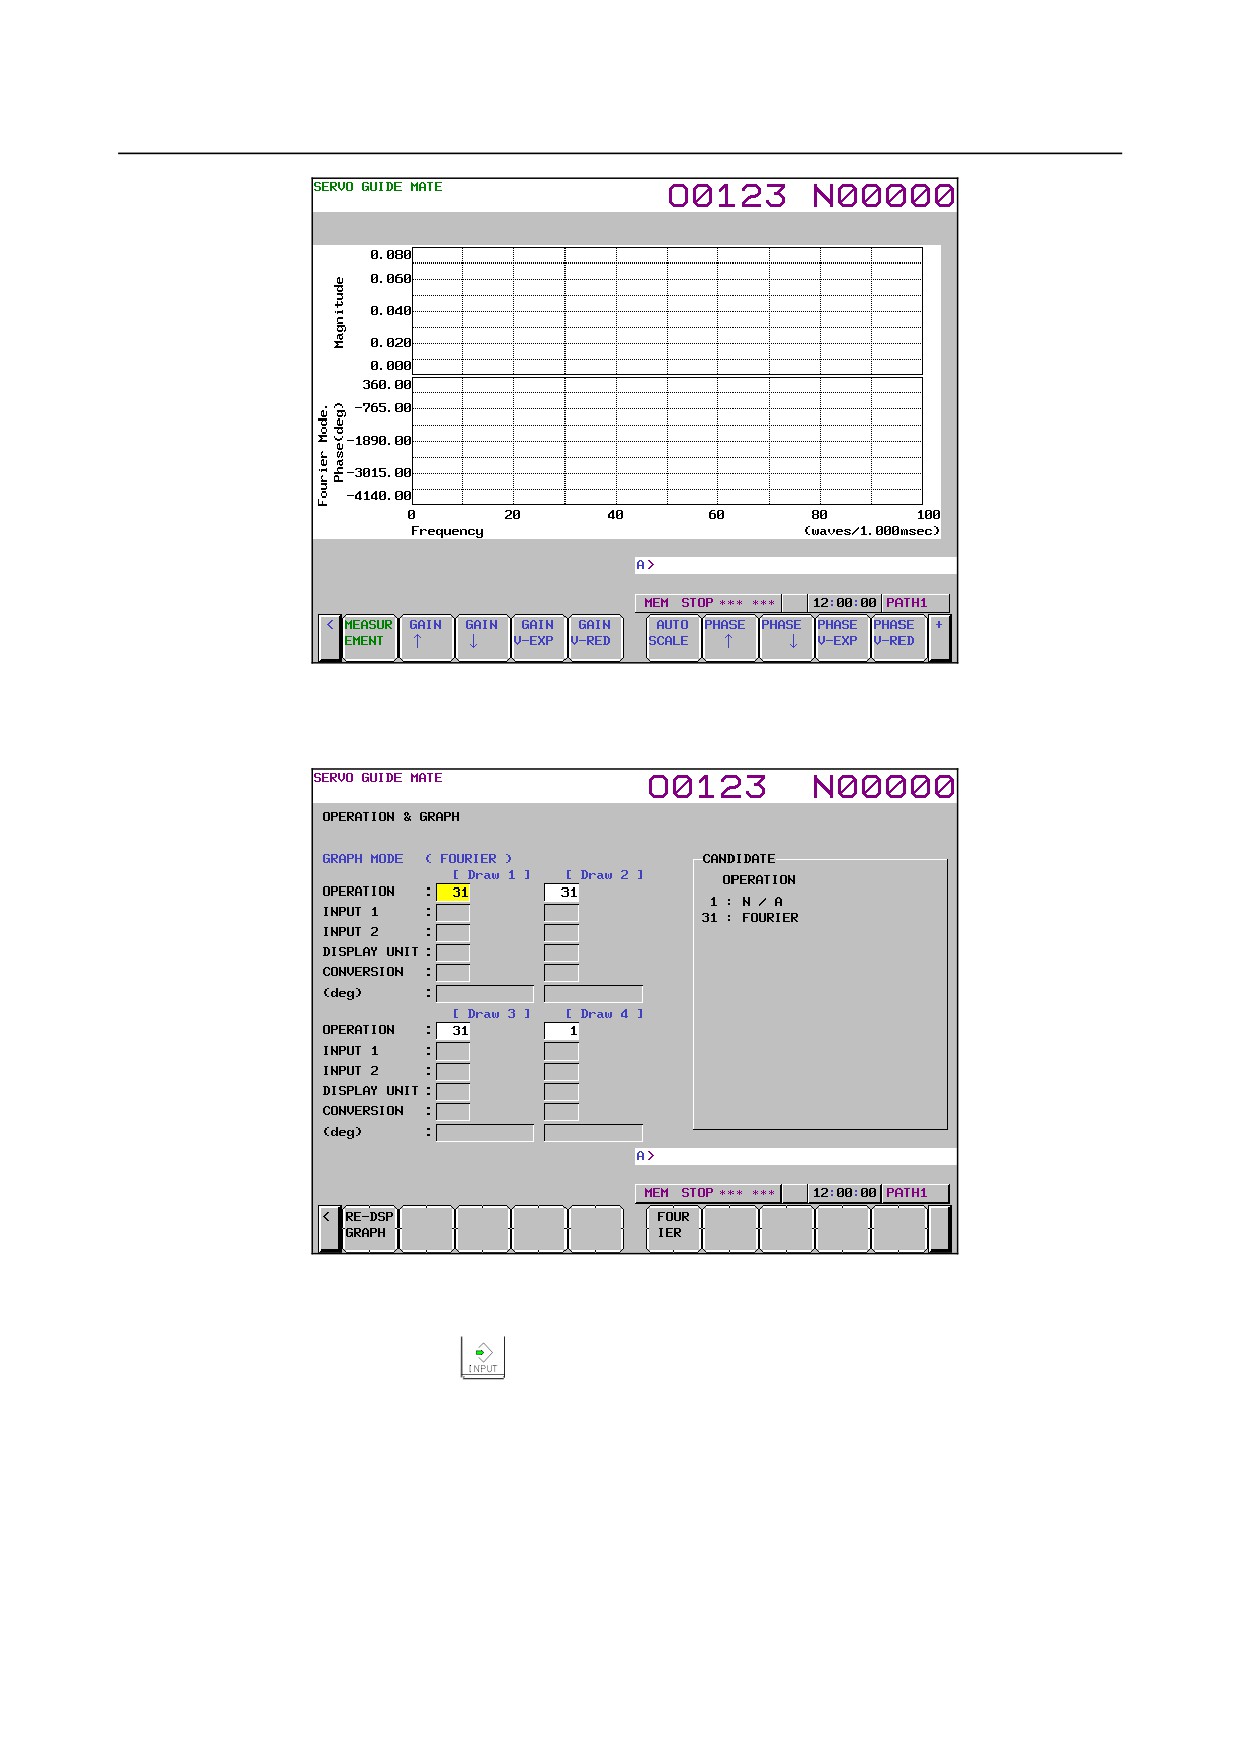
Click the soft key [FOURIER].
The wave display screen is displayed as shown Fig. 1.9.1.4 (a).
- 114 -
B-64485EN/01
1.DISPLAY AND OPERATION
Fig. 1.9.1.4 (a)
3
Click the soft key [OPERATION & GRAPH].
The operation and graph setting screen is displayed as shown Fig. 1.9.1.4 (b).
Fig. 1.9.1.4 (b)
4
Move the cursor to the parameter you want to set, by pressing the cursor key.
5
Enter data and the press the
key.
6
Repeat steps 4 and 5 until you set all the parameters.
7
Click the soft key [RE-DSPGRAPH].
8
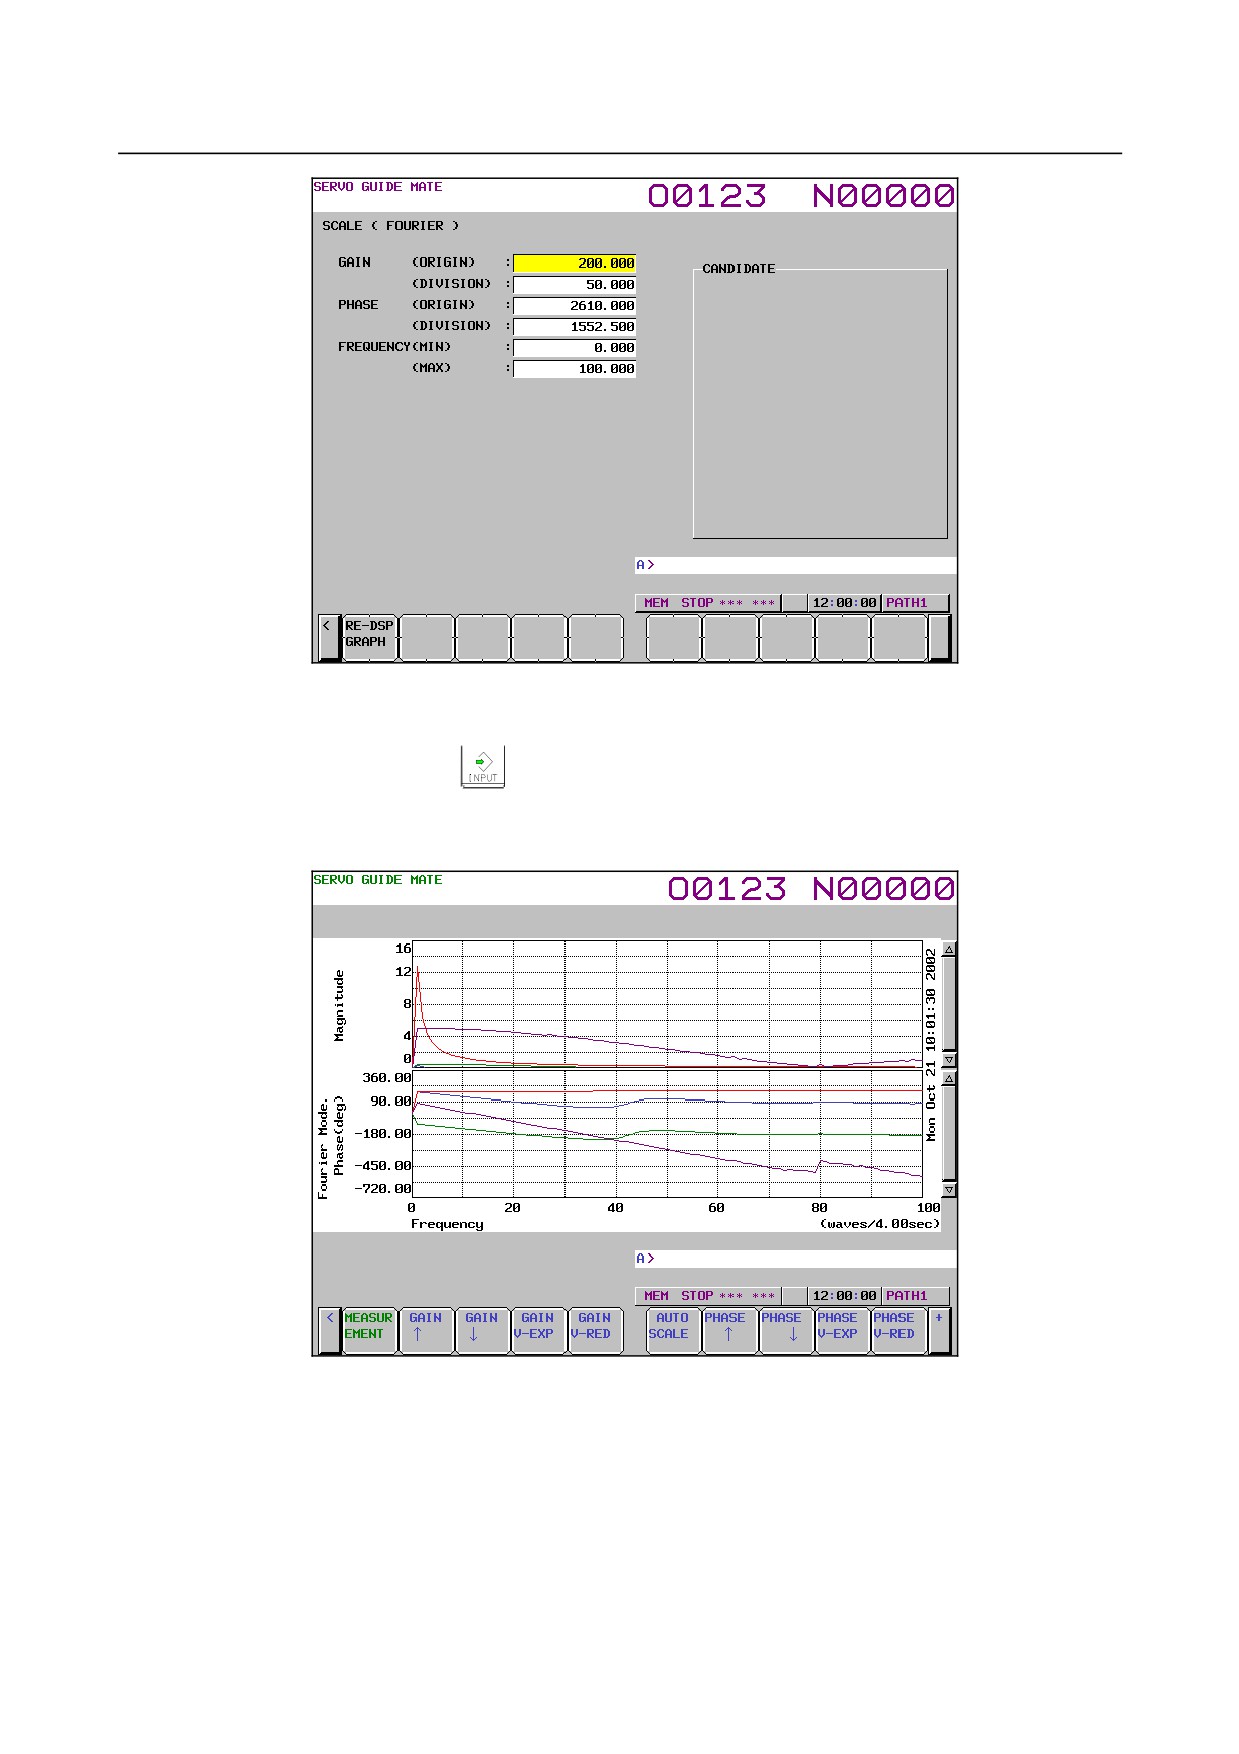
Click the soft key [SCALE SET].
The scale setting screen is displayed as shown Fig. 1.9.1.4 (c).
- 115 -
1.DISPLAY AND OPERATION
B-64485EN/01
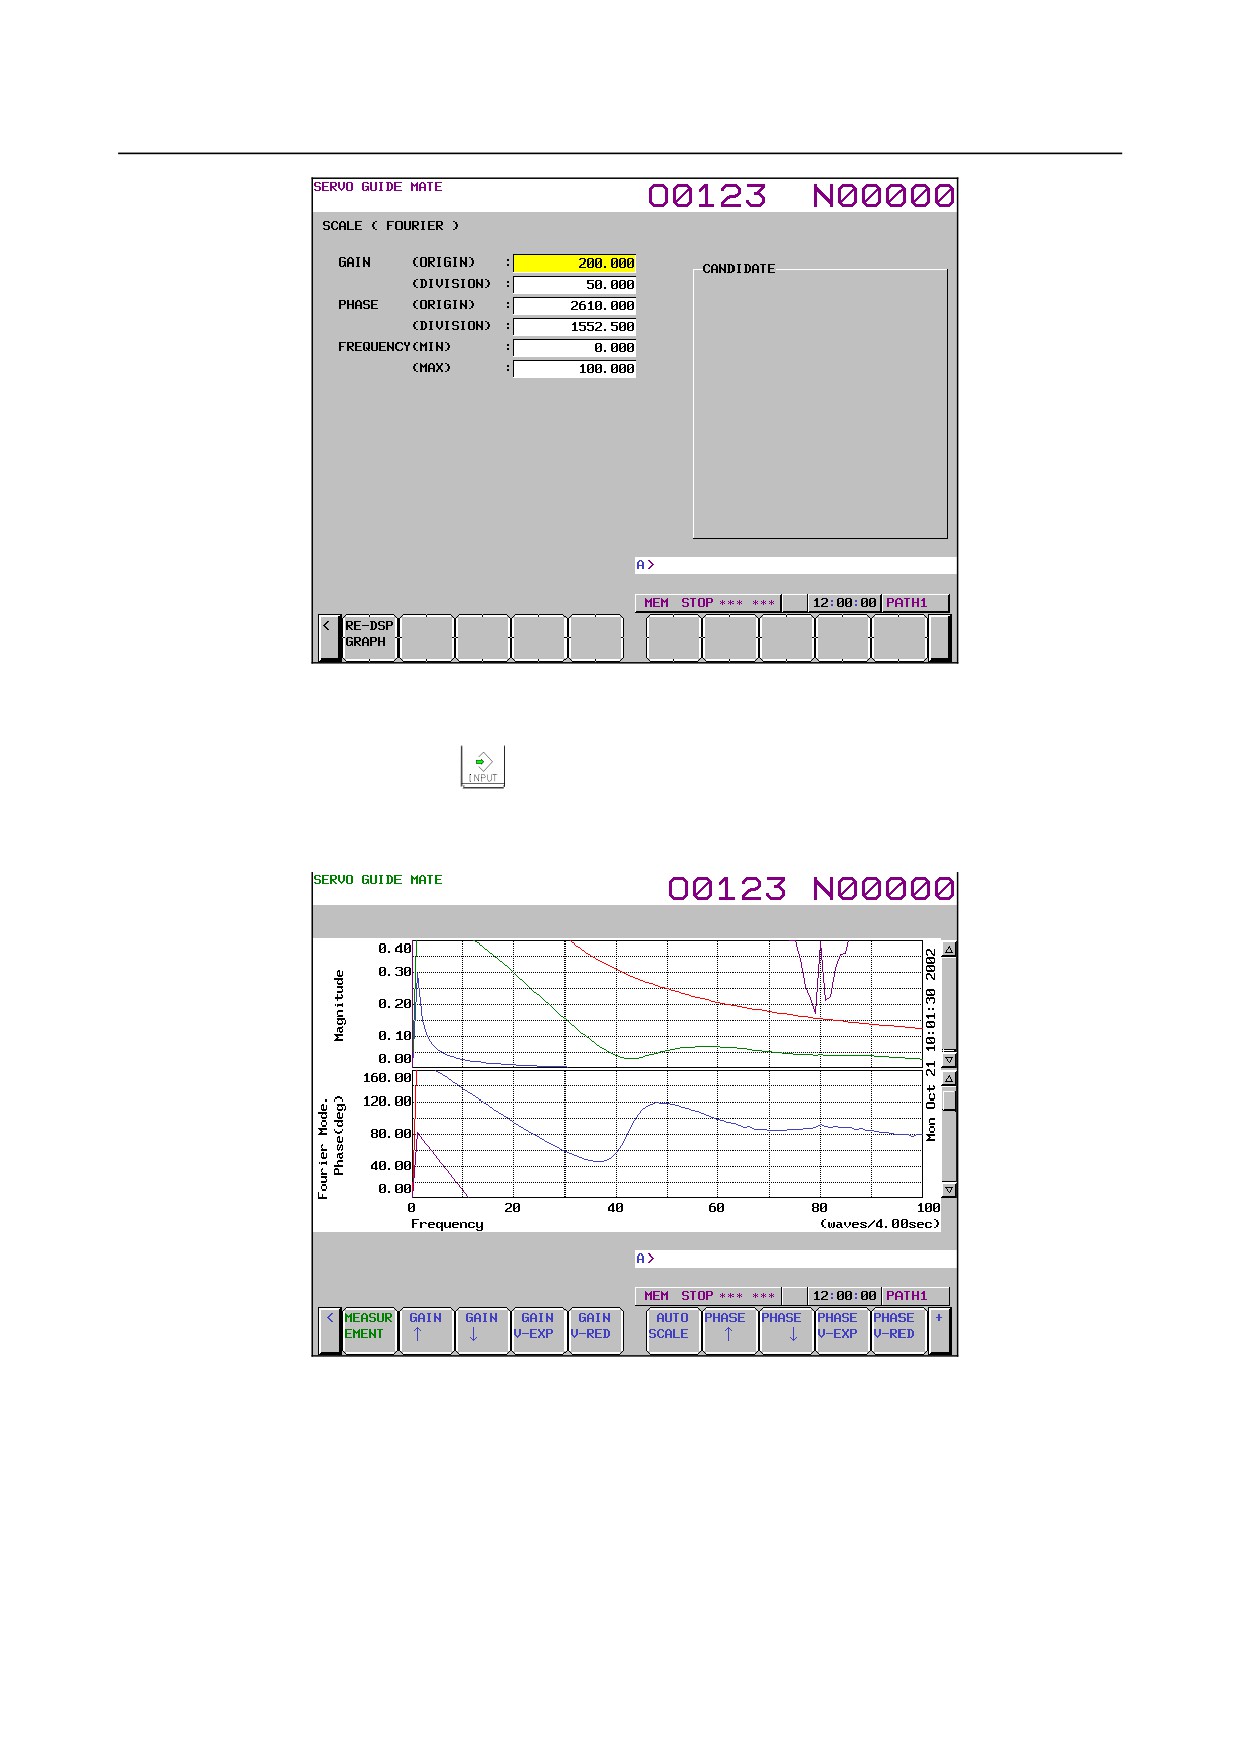
Fig. 1.9.1.4 (c)
9
Move the cursor to the parameter you want to set, by pressing the cursor key.
10 Enter data and the press the
key.
11 Repeat steps 9 and 10 until you set all the parameters.
12 Click the soft key [RE-DSPGRAPH].
The wave display screen is displayed as shown Fig. 1.9.1.4 (d).
Fig. 1.9.1.4 (d)
-
Changing the operation and graph setting screen
The procedure for changing the operation and graph setting screen as necessary is described below.
1
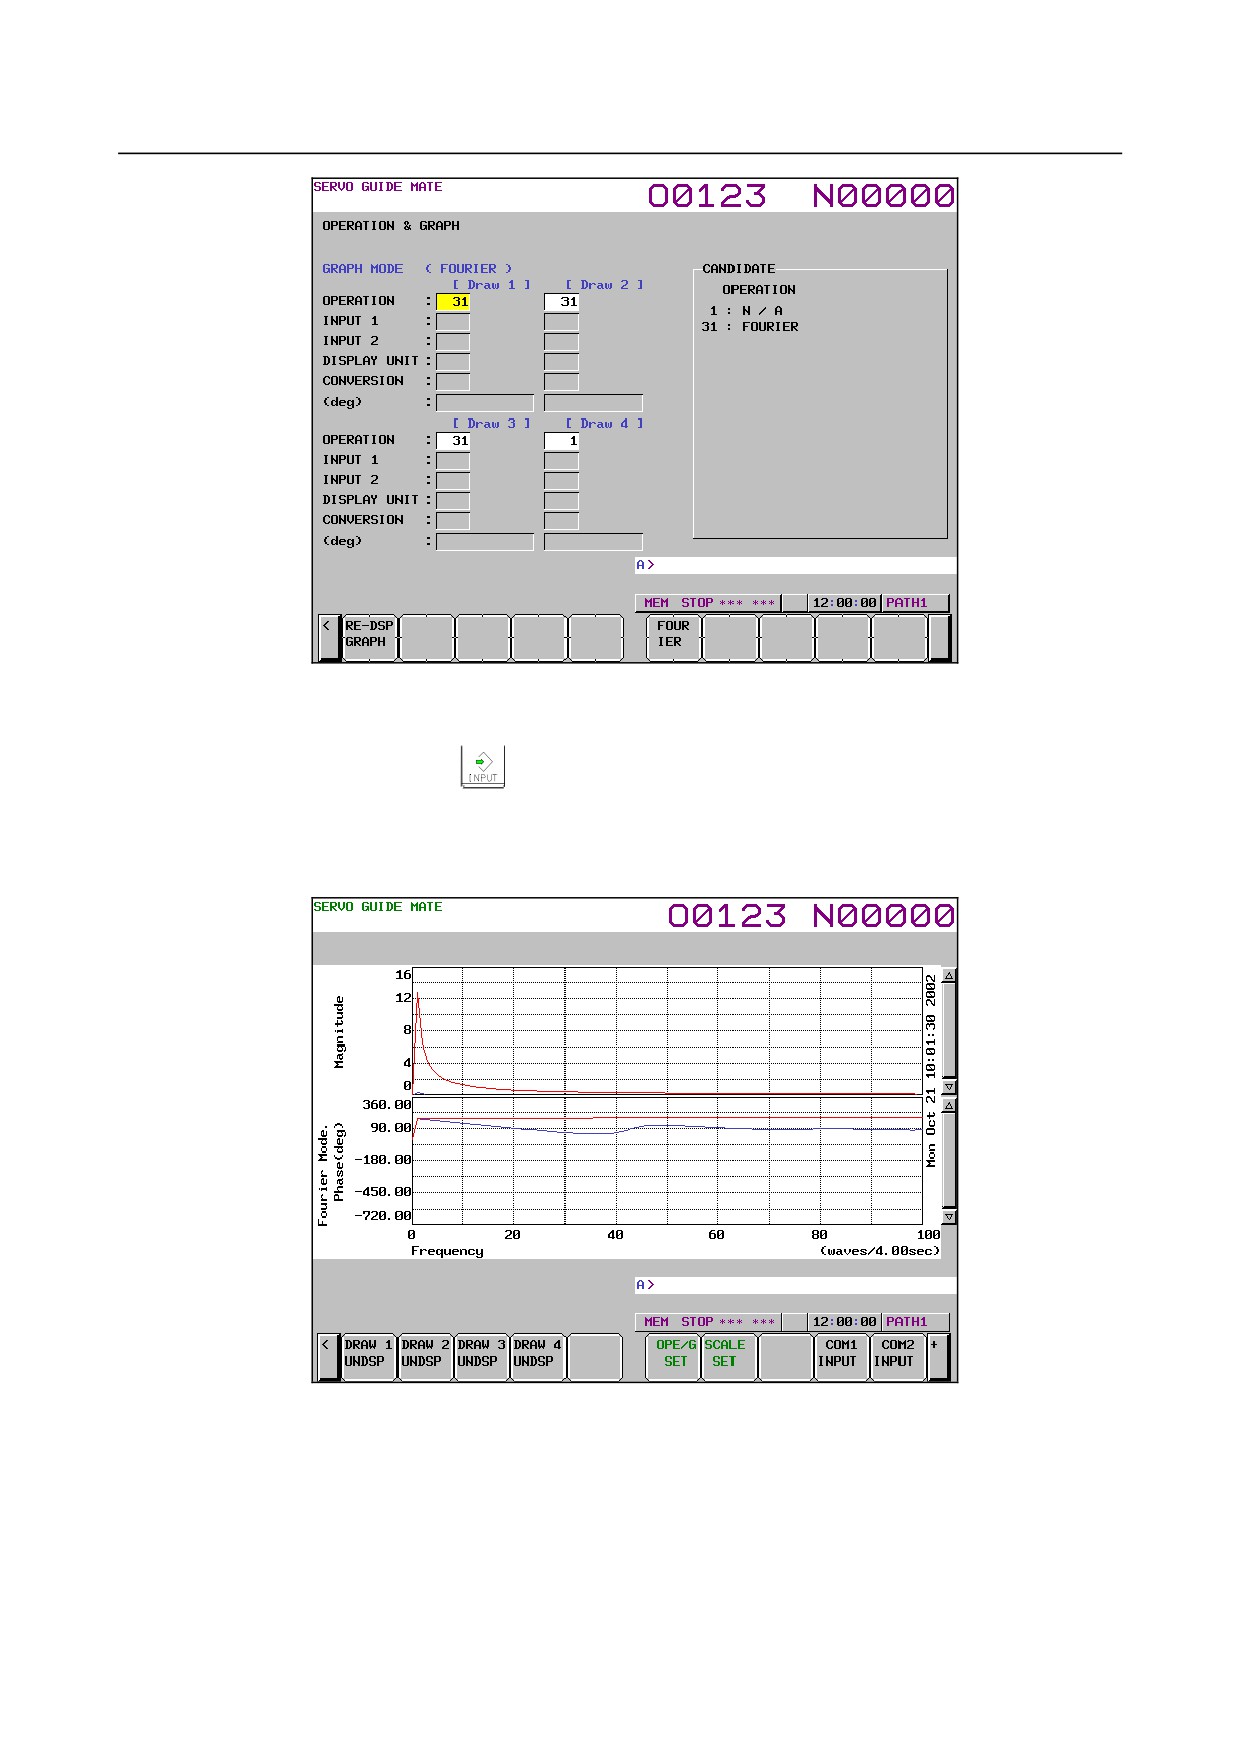
Click the soft key [OPERATION & GRAPH].
The operation and graph setting screen is displayed as shown Fig. 1.9.1.4 (e).
- 116 -
B-64485EN/01
1.DISPLAY AND OPERATION
Fig. 1.9.1.4 (e)
2
Move the cursor to the parameter you want to set, by pressing the cursor key.
3
Enter data and the press the
key.
4
Repeat steps 2 and 3 until you set all the parameters.
5
Click the soft key [RE-DSPGRAPH].
Based on the new operation and graph settings, the wave display screen is displayed as shown Fig.
1.9.1.4 (f).
Fig. 1.9.1.4 (f)
-
Changing the scale screen
The procedure for changing the scale settings as necessary is described below.
1
Click the soft key [SCALE SET].
The scale setting screen is displayed as shown Fig. 1.9.1.4 (g).
- 117 -
1.DISPLAY AND OPERATION
B-64485EN/01
Fig. 1.9.1.4 (g)
2
Move the cursor to the parameter you want to set, by pressing the cursor key.
3
Enter data and the press the
key.
4
Repeat steps 2 and 3 until you set all the parameters.
5
Click the soft key [RE-DSPGRAPH].
Based on the new scale settings, the wave display screen is displayed as shown Fig. 1.9.1.4 (h).
Fig. 1.9.1.4 (h)
-
Manipulating the Fourier graph
By clicking the following soft keys, you can perform the operations corresponding to them.
[MEASUREMENT] : Performs a measurement-related operation.
[GAIN ↑]
: Shifts the gain graph downward.
[GAIN ↓]
: Shifts the gain graph upward.
[GAIN V-EXP]
: Expands the gain graph.
[GAIN V-RED]
: Reduces the gain graph.
[AUTO SCALE]
: Enables auto scaling.
- 118 -
B-64485EN/01
1.DISPLAY AND OPERATION
[PHASE ↑]
: Shifts the phase graph downward.
[PHASE ↓]
: Shifts the phase graph upward.
[PHASE V-EXP]
: Expands the phase graph.
[PHASE V-RED]
: Reduces the phase graph.
[DRAW 1UNDSP]
: Sets whether or not to display Draw 1.
[DRAW 2UNDSP]
: Sets whether or not to display Draw 2.
[DRAW 3UNDSP]
: Sets whether or not to display Draw 3.
[DRAW 4UNDSP]
: Sets whether or not to display Draw 4.
[OPE/G SET]
: Sets operations and graphs.
[SCALE SET]
: Sets scales.
[COM1 INPUT]
: Inputs comment 1.
[COM2 INPUT]
: Inputs comment 2.
[Y-TIME]
: Switches to the Y-Time.
[XY]
: Switches to the XY graph.
[CIRCLE]
: Switches to the Circle graph.
[BODE]
: Switches to the Bode graph.
Explanation
-
Setting the operation and graph setting screen
The operation and graph setting screen lets you specify up to four graph settings per draw.
• Operation
The specifiable values are as shown in Table 1.9.1.4 (a), Fourier graph operations.
An operation cannot be specified if it does not meet the graph display conditions defined in Table
1.9.1.4 (b), Fourier graph conditions.
Table 1.9.1.4 (a) Fourier graph operations
Input value
Operation name
Description
1
N/A
Not displayed.
31
Fourier
Displays the frequency spectrum by performing digital Fourier conversion.
Table 1.9.1.4 (b) Fourier graph conditions
Operation
Condition
Remarks
Draws of the Y-time graph correspond to those of the Fourier graph on
31 : Fourier
a one-to-one basis. The Fourier operation can be set only when the
corresponding Y-time graph draw is effective.
-
Setting the scale screen
• Start point
Set gain and phase data values for the center of the graph.
• Division
Set the value of one grid.
• Frequency
Set the minimum and maximum values of the horizontal axis. Since the unit is dependent on the time
range selected for the Y-time graph, 1 is not necessarily equal to 1 Hz.
(Example)
When a 0.1-second time range is selected, 1 is equal to 1 Hz.
Limitation
See the Limitation section for the Y-time graph.
- 119 -
1.DISPLAY AND OPERATION
B-64485EN/01
1.9.1.5 Bode graph
This graph displays a Bode diagram for the measurement data in the form of a horizontal axis logarithm
graph.
Only one draw can be displayed at a time.
Displaying and setting the Bode graph
Procedure
To display the Bode graph, set the parameters for automatic vibration (disturbance input function) using
servo software.
The procedure for displaying the measurement data is described below.
1
Press the
function key.
2
Press and hold this key until [PARAMETER] appears.
3
Set the following parameters.
No.2326 (Disturbance input gain)
Recommended value: 500
No.2327 (Start frequency of disturbance input) Recommended value: 10
No.2328 (End frequency of disturbance input) Recommended value: 1000
No.2329 (Number of disturbance input measurement points)
Recommended value:3
4
When bit 7 (DSTIN) of parameter No. 2270 changes from 0 to 1, disturbance input starts. This
operation needs to be performed to start measurement, so a program that changes bit 7 (DSTIN) of
parameter No. 2270 from 0 to 1 with program data input (G10) must have been created in advance.
Programming example: When the Z-axis (third axis) is vibrated (when bit 4 (G1B) of parameter 3454 is
1)
O1234
N1G10L52 ;
Parameter input mode (this N number is used for a trigger.)
N2270 P3 Q7 R1;
Set DSTIN (bit 7 of parameter No. 2270).
G11 ;
Cancel the parameter input mode.
N2G04X10.;
Wait for completion of vibration.
N99G10L52 ;
Parameter input mode
N2270 P3 Q7 R0;
Clear DSTIN (bit 7 of parameter No. 2270).
G11 ;
Cancel the parameter input mode.
M30
5
Press the continuous menu key
several times until [SERVO GUIDE MATE] is displayed.
6
Click the soft key [SERVO GUIDE MATE].
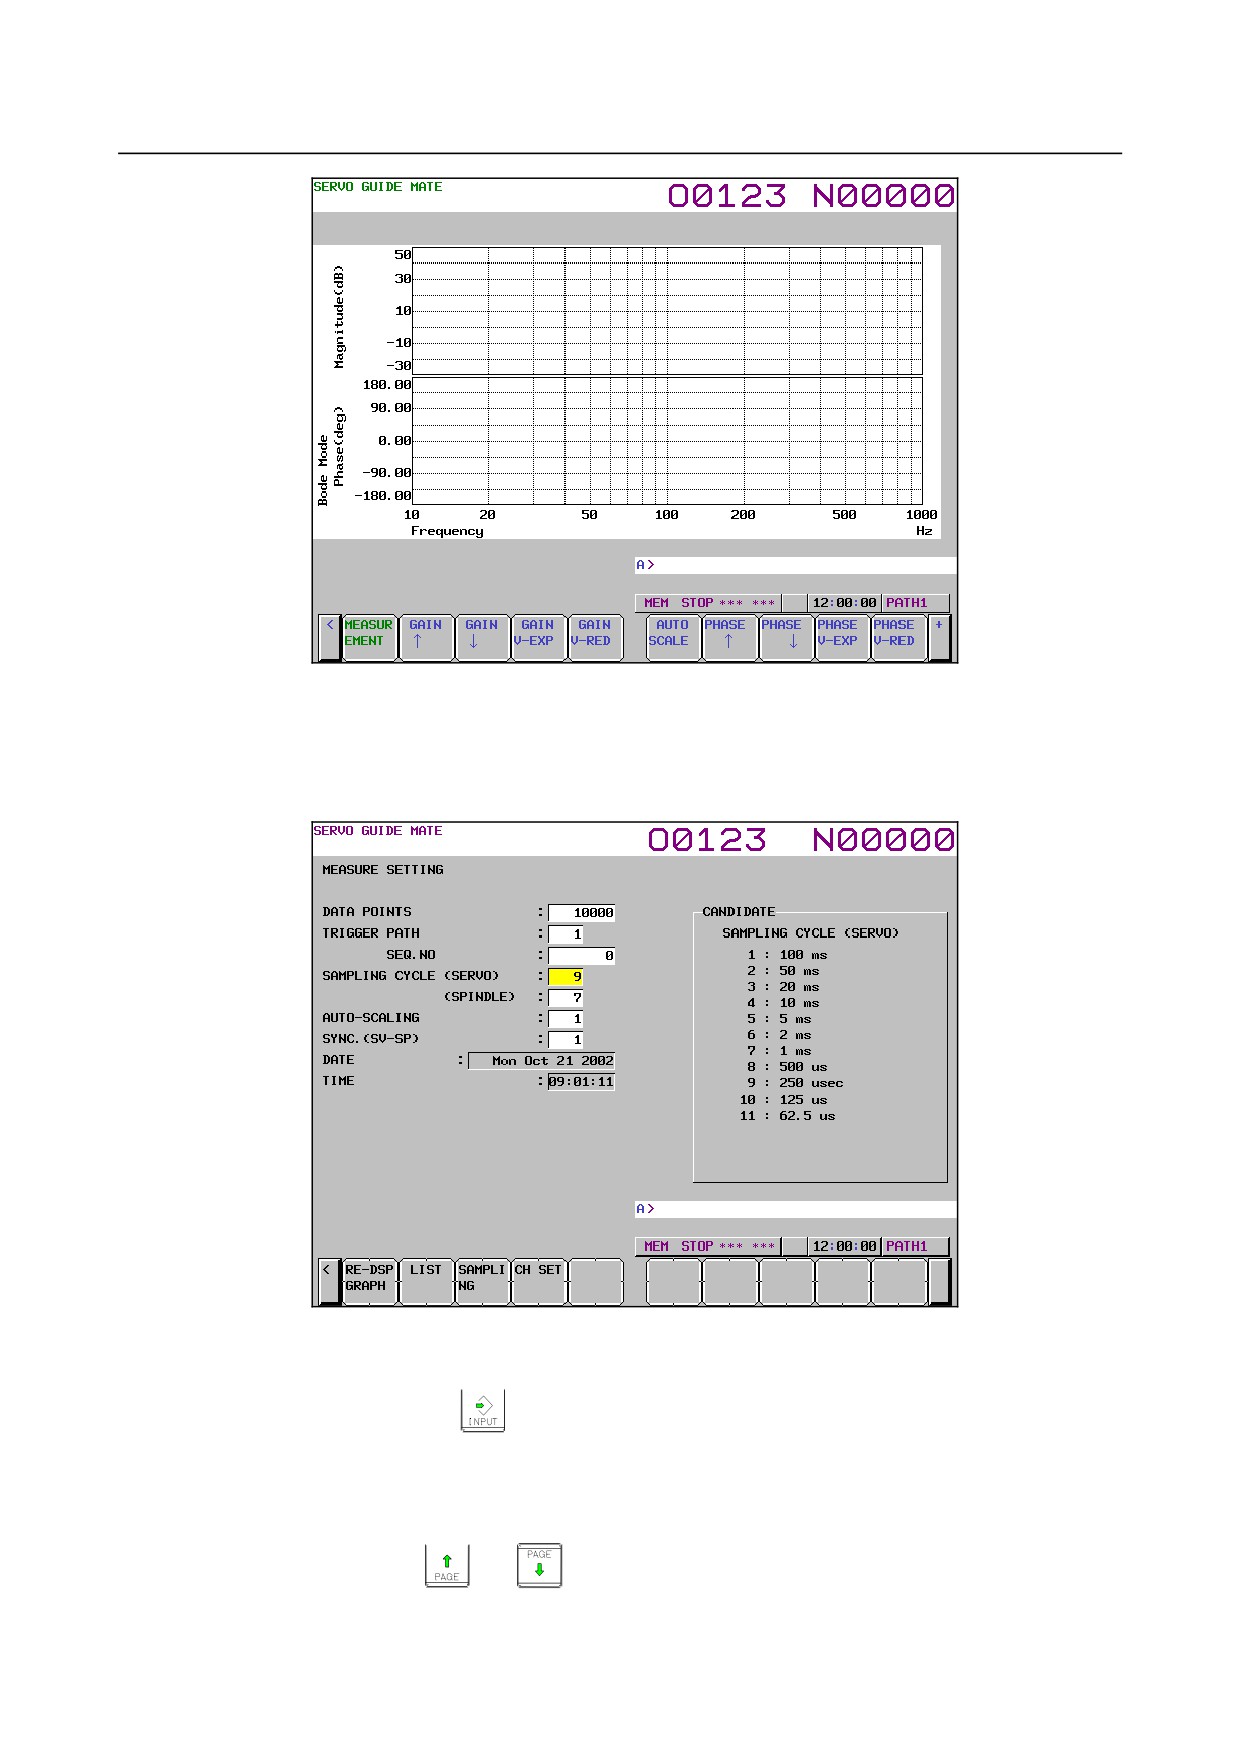
7
Click the soft key [BODE].
The wave display screen is displayed as shown Fig. 1.9.1.5 (a).
- 120 -
B-64485EN/01
1.DISPLAY AND OPERATION
Fig. 1.9.1.5 (a)
8
Click the soft key [MEASUREMENT].
9
Click the soft key [DATA IN].
10
Click the soft key [SAMPLING].
The data-in screen is displayed as shown Fig. 1.9.1.5 (b).
Fig. 1.9.1.5 (b)
11 Move the cursor to the parameter you want to set, by pressing the cursor key.
12 Enter data and the press the
key.
13 Repeat steps 11 and 12 until you set all the parameters.
14 Click the soft key [SET CHANNEL].
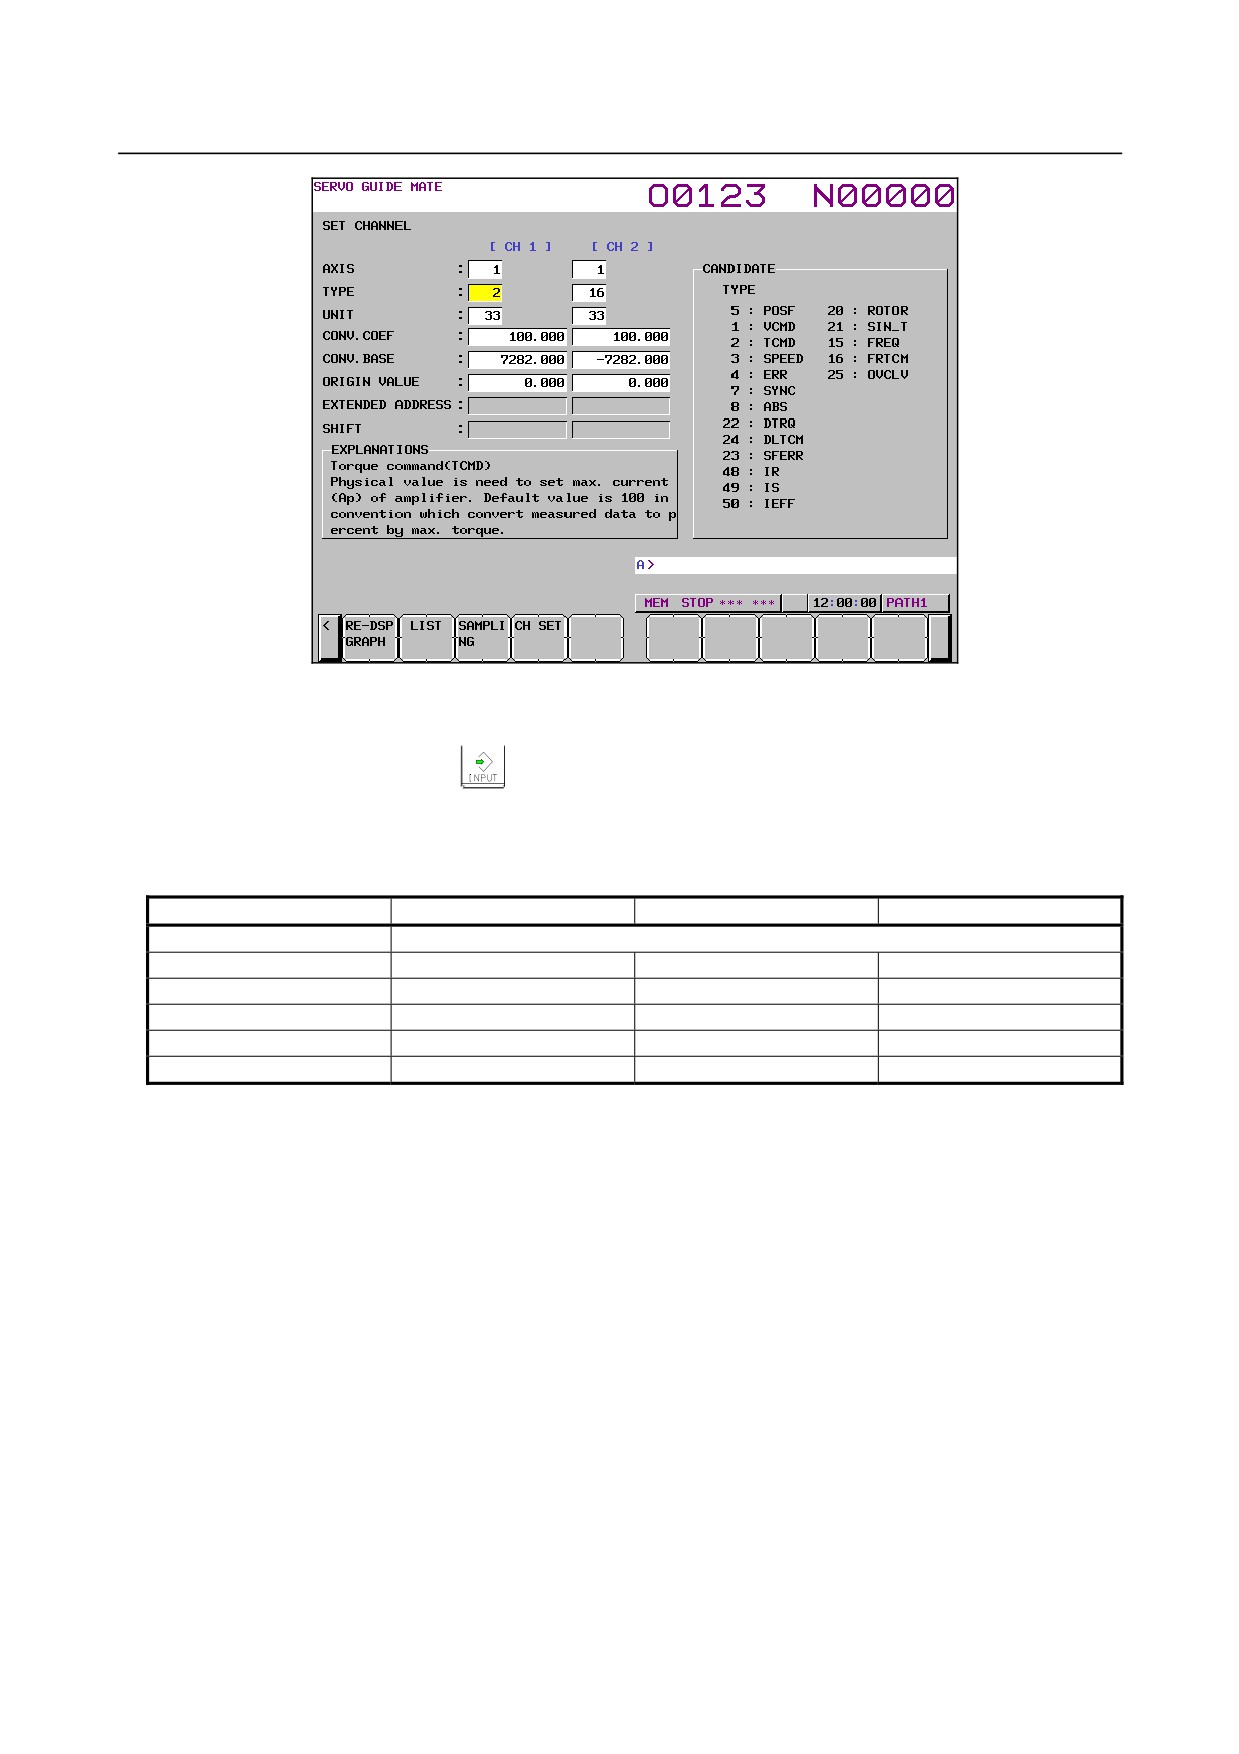
The channel setting screen is displayed as shown Fig. 1.9.1.5 (c).
To set any channel other than the one currently displayed, display the setting screen for the desired
channel by pressing the
or
key.
- 121 -
1.DISPLAY AND OPERATION
B-64485EN/01
Fig. 1.9.1.5 (c)
15 Move the cursor to the parameter you want to set, by pressing the cursor key.
16 Enter data and the press the
key.
17 Repeat steps 15 and 16 until you set all the parameters.
To display the Bode graph, make the channel settings of the Bode graph in Table 1.9.1.5 (a). At this
time, be sure to disable channel 4 (axis for channel 4 is 0).
Table 1.9.1.5 (a) Bode graph channel settings
Channel 1
Channel 2
Channel 3
AXIS
Specify the same servo motor axis.
TYPE
2 : TCMD
16 : FRTCM
15 : FREQ
UNIT
33 : %
33 : A(p)
32 : Hz
CONV.COEF
100
100
1
CONV.BASE
7282
-7282
1
ORIGIN VALUE
0
0
0
Set a trigger that corresponds to the program prepared in step 4.
(In the programming example, set N number for a trigger to 1.)
18 Click the soft key [RE-DSPGRAPH].
19 Click the soft key [OPERATION & GRAPH].
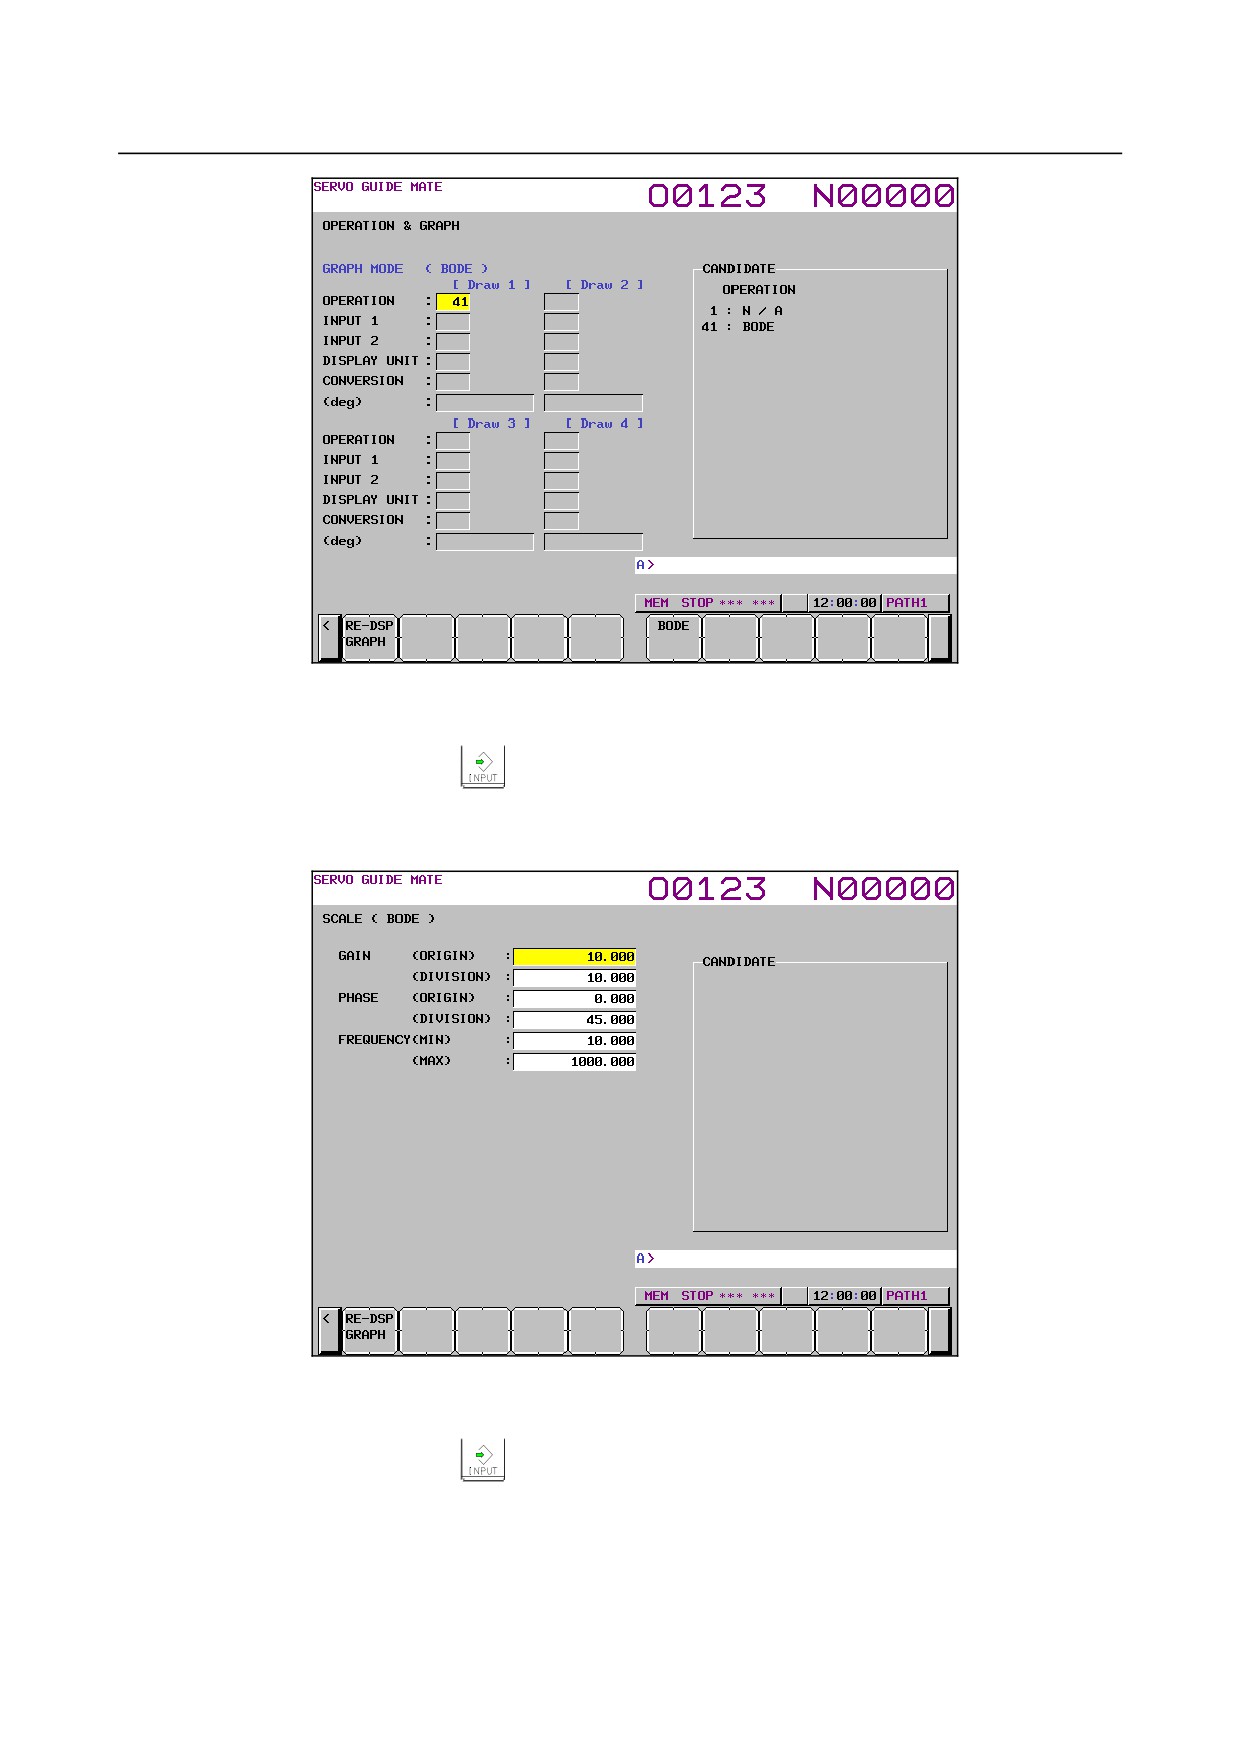
The operation and graph setting screen is displayed as shown Fig. 1.9.1.5 (d).
- 122 -
B-64485EN/01
1.DISPLAY AND OPERATION
Fig. 1.9.1.5 (d)
20 Move the cursor to the parameter you want to set, by pressing the cursor key.
21 Enter data and the press the
key.
22 Click the soft key [RE-DSPGRAPH].
23 Click the soft key [SCALE SET].
The scale setting screen is displayed as shown Fig. 1.9.1.5 (e).
Fig. 1.9.1.5 (e)
24 Move the cursor to the parameter you want to set, by pressing the cursor key.
25 Enter data and the press the
key.
26 Repeat steps 21 and 22 until you set all the parameters.
27 Click the soft key [RE-DSPGRAPH].
28 Click the soft key [MEASUREMENT].
29 Click the soft key [START].
30 Perform automatic operation of the program prepared in step 4.
- 123 -
1.DISPLAY AND OPERATION
B-64485EN/01
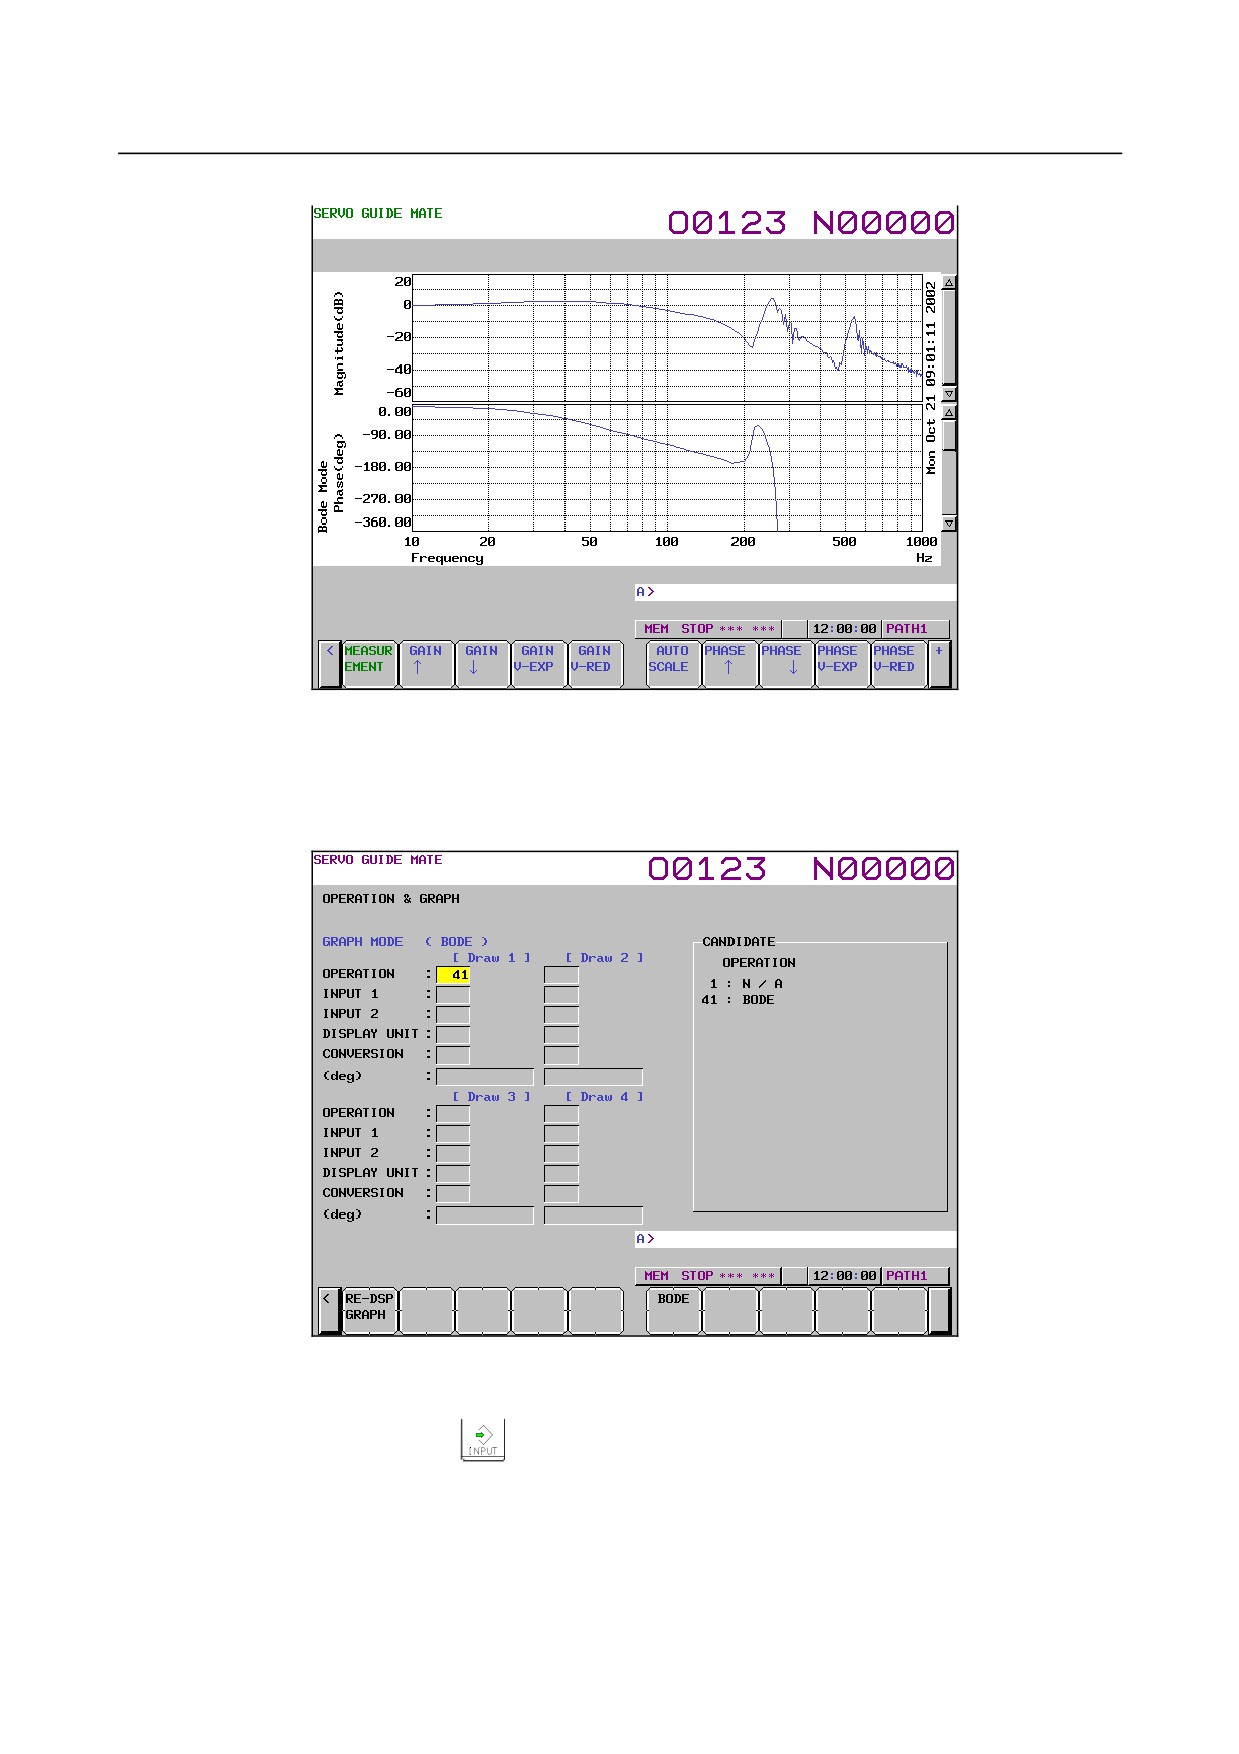
28 When the measurement is completed, the wave display screen is displayed as shown Fig. 1.9.1.5 (f).
Fig. 1.9.1.5 (f)
-
Changing the operation and graph setting screen
The procedure for changing the operation and graph setting screen as necessary is described below.
1
Click the soft key [OPERATION & GRAPH].
The operation and graph setting screen is displayed as shown Fig. 1.9.1.5 (g).
Fig. 1.9.1.5 (g)
2
Move the cursor to the parameter you want to set, by pressing the cursor key.
3
Enter data and the press the
key.
4
Click the soft key [RE-DSPGRAPH].
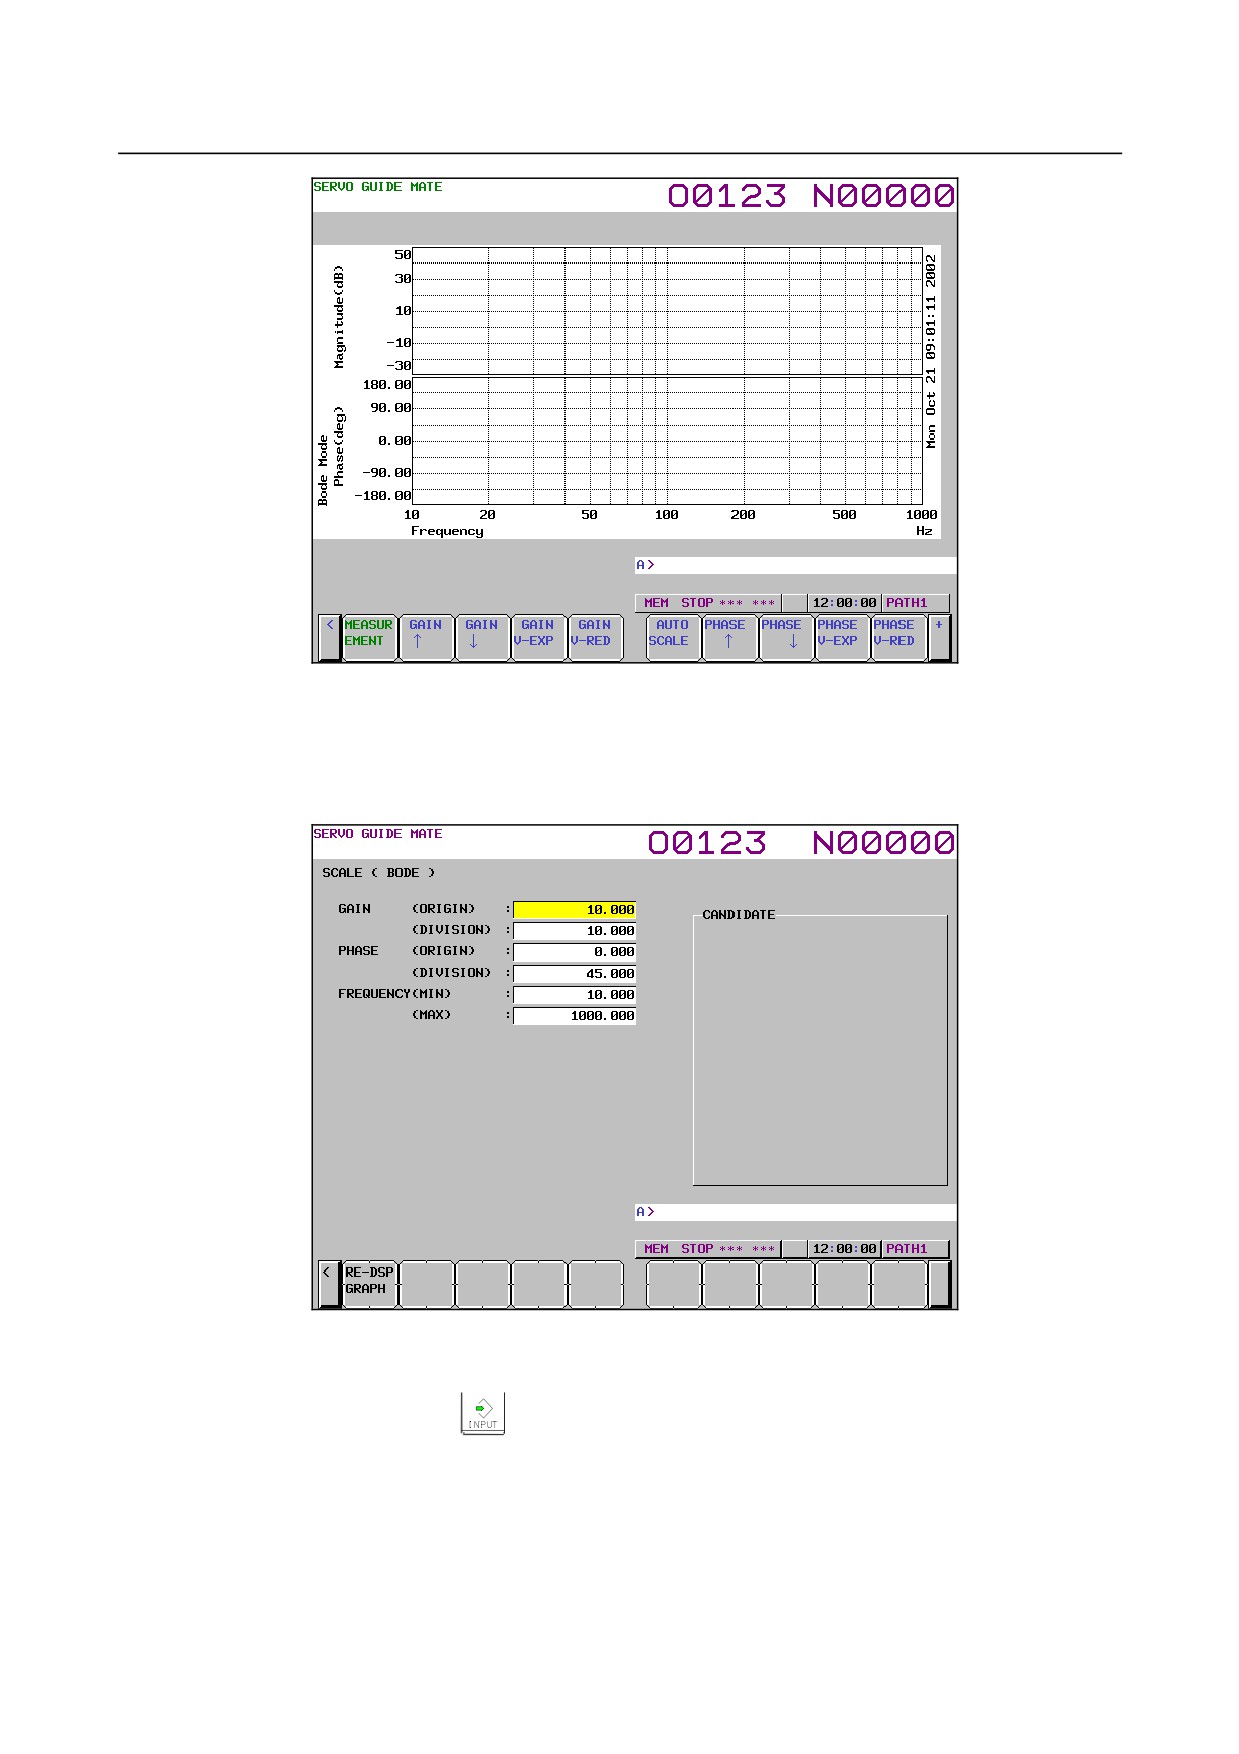
Based on the new operation and graph settings, the wave display screen is displayed as shown Fig.
1.9.1.5 (h).
- 124 -
B-64485EN/01
1.DISPLAY AND OPERATION
Fig. 1.9.1.5 (h)
-
Changing the scale screen
The procedure for changing the scale settings as necessary is described below.
1
Click the soft key [SCALE SET].
The scale setting screen is displayed as shown Fig. 1.9.1.5 (i).
Fig. 1.9.1.5 (i)
2
Move the cursor to the parameter you want to set, by pressing the cursor key.
3
Enter data and the press the
key.
4
Repeat steps 2 and 3 until you set all the parameters.
5
Click the soft key [RE-DSPGRAPH].
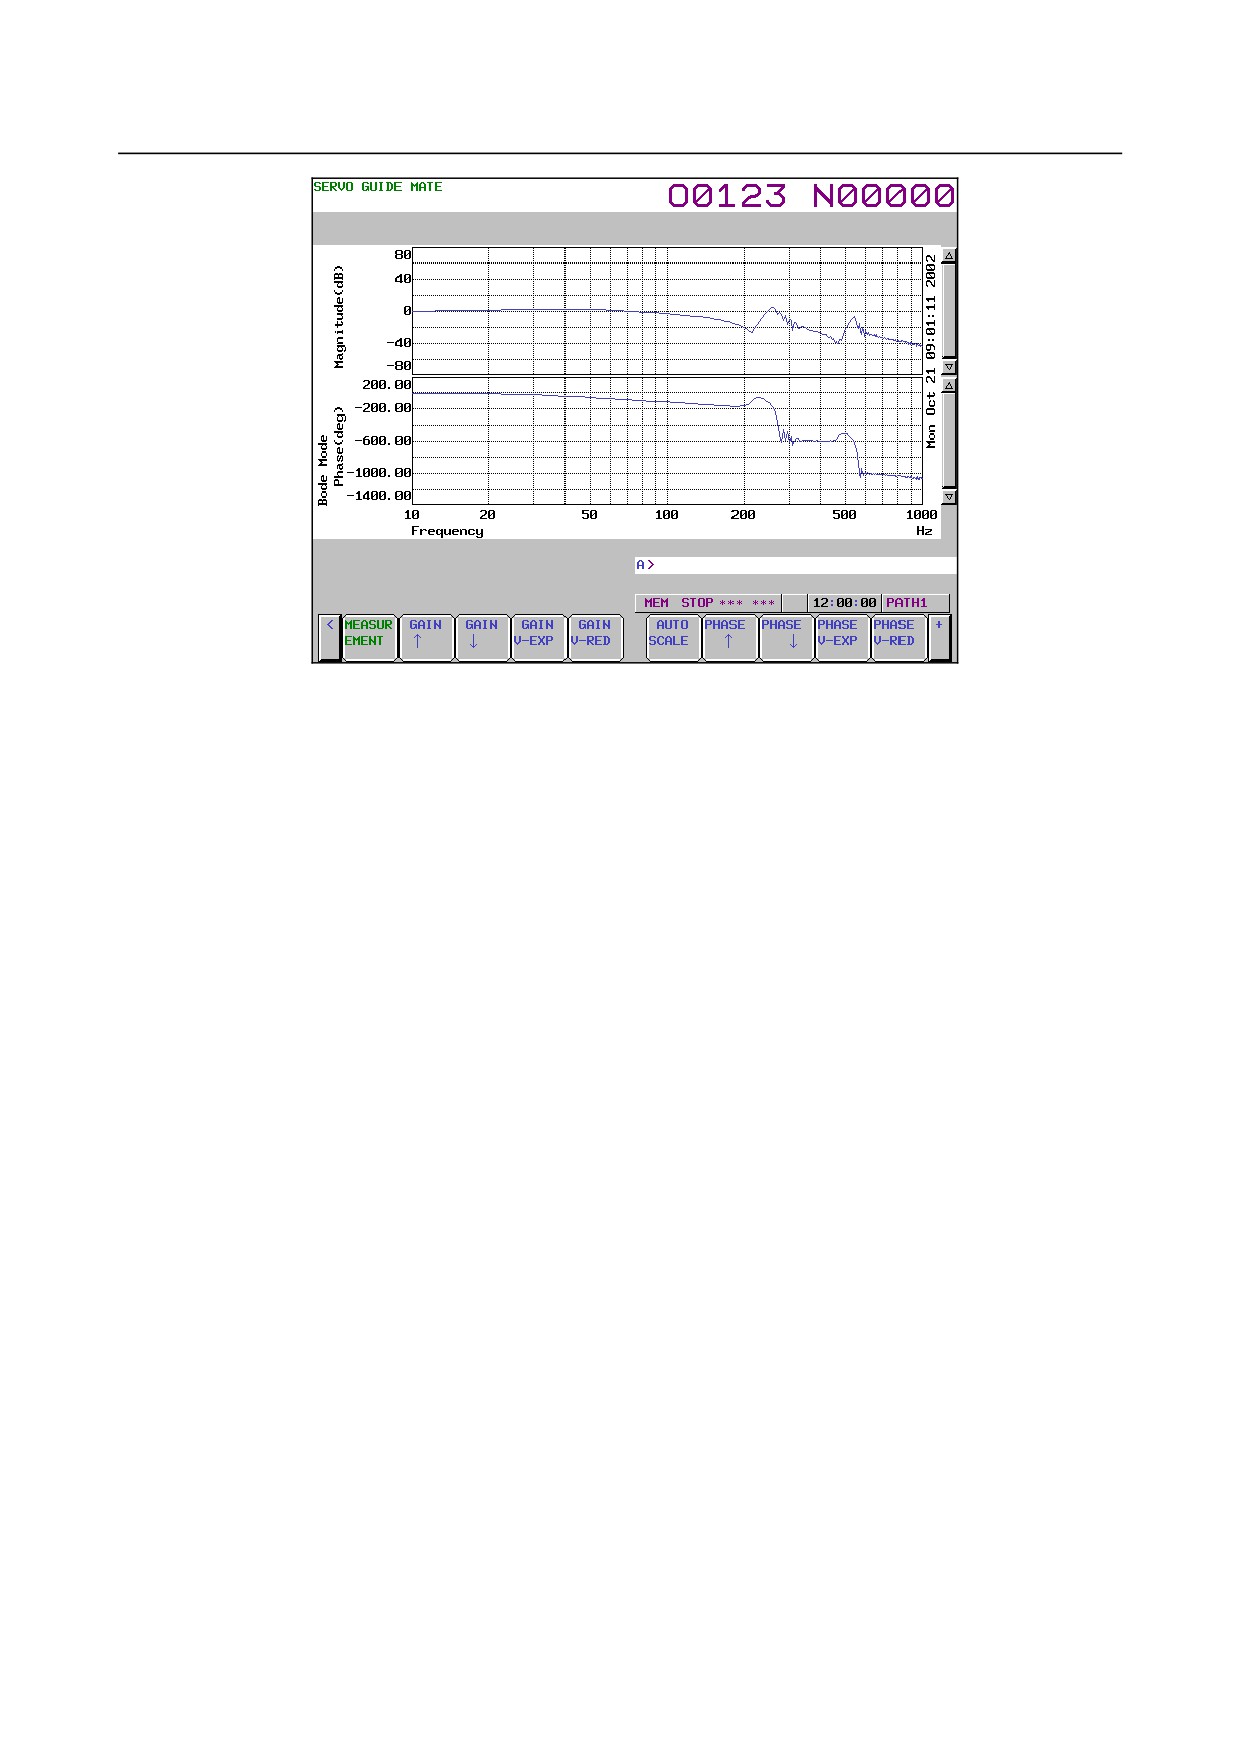
Based on the new scale settings, the wave display screen is displayed as shown Fig. 1.9.1.5 (j).
- 125 -
1.DISPLAY AND OPERATION
B-64485EN/01
Fig. 1.9.1.5 (j)
-
Manipulating the Bode graph
By clicking the following soft keys, you can perform the operations corresponding to them.
[MEASUREMENT] : Performs a measurement-related operation.
[GAIN ↑]
: Shifts the gain graph downward.
[GAIN ↓]
: Shifts the gain graph upward.
[GAIN V-EXP]
: Expands the gain graph.
[GAIN V-RED]
: Reduces the gain graph.
[AUTO SCALE]
: Enables auto scaling.
[PHASE ↑]
: Shifts the phase graph downward.
[PHASE ↓]
: Shifts the phase graph upward.
[PHASE V-EXP]
: Expands the phase graph.
[PHASE V-RED]
: Reduces the phase graph.
[DRAW 1UNDSP]
: Sets whether or not to display Draw 1.
[OPE/G SET]
: Sets operations and graphs.
[SCALE SET]
: Sets scales.
[COM1 INPUT]
: Inputs comment 1.
[COM2 INPUT]
: Inputs comment 2.
[Y-TIME]
: Switches to the Y-Time.
[XY]
: Switches to the XY graph.
[CIRCLE]
: Switches to the Circle graph.
[FOURIER]
: Switches to the Fourier graph.
-
Performing measurement
When you click the soft key [MEASUREMENT], you can perform the operations corresponding to the
menu items that follow.
[START]
: Starts measurement.
[ORIGIN]
: Sets the origin value.
[STOP]
: Stops measurement.
[DATA IN]
: Specifies measurement-related settings.
-
Changing measurement settings
1
When you click the soft key [MEASUREMENT] and then the soft key [DATA IN], you can perform
the operations corresponding to the menu items that follow.
- 126 -
B-64485EN/01
1.DISPLAY AND OPERATION
2
Click the soft key [LIST].
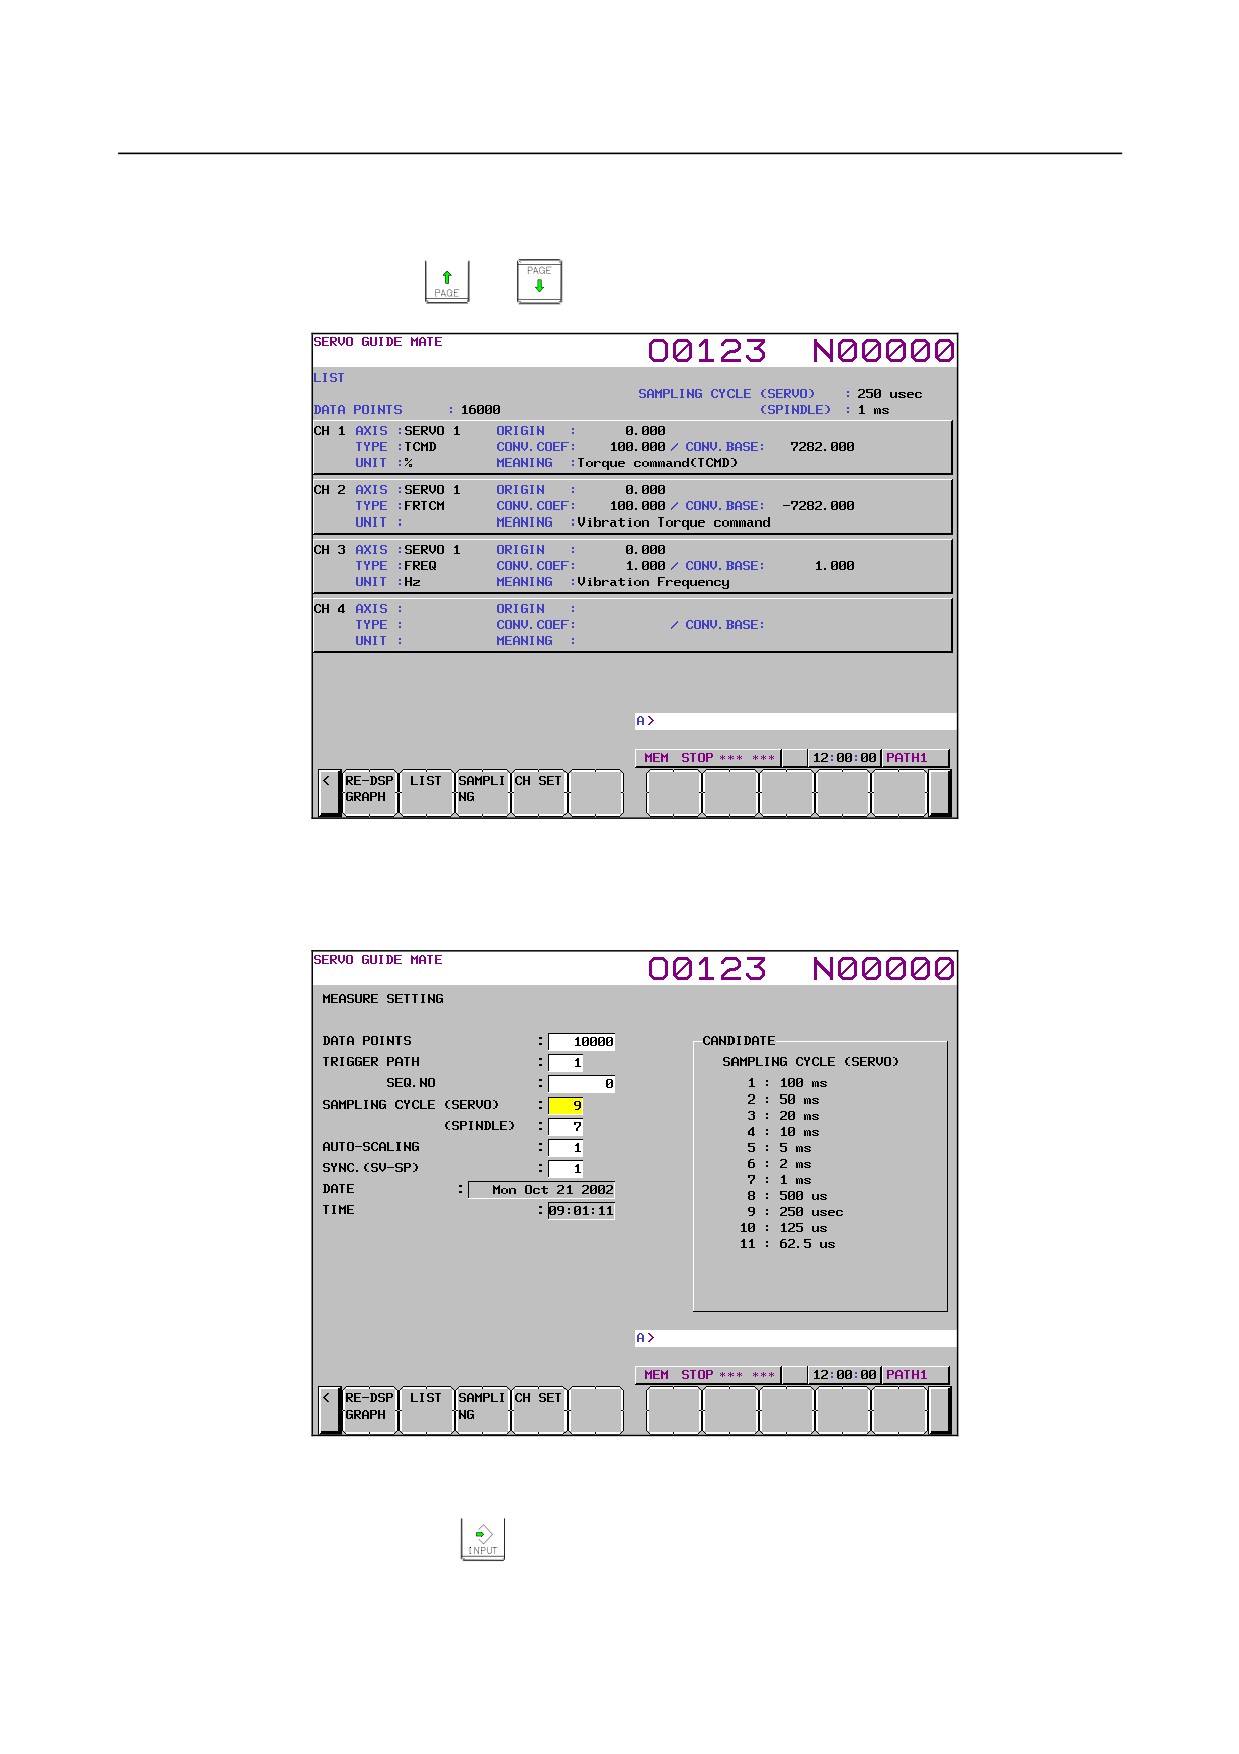
The list screen is displayed as shown Fig. 1.9.1.5 (k).
To display any channel other than the one currently displayed, display the list screen for the desired
channel by pressing the
or
key.
Fig. 1.9.1.5 (k)
3
Check the current settings on the list screen.
4
Click the soft key [SAMPLING].
The data-in screen is displayed as shown Fig. 1.9.1.5 (l).
Fig. 1.9.1.5 (l)
5
Move the cursor to the parameter you want to set, by pressing the cursor key.
6
Enter data and the press the
key.
7
Repeat steps 5 and 6 until you set all the parameters.
- 127 -
1.DISPLAY AND OPERATION
B-64485EN/01
8
Click the soft key [SET CHANNEL].
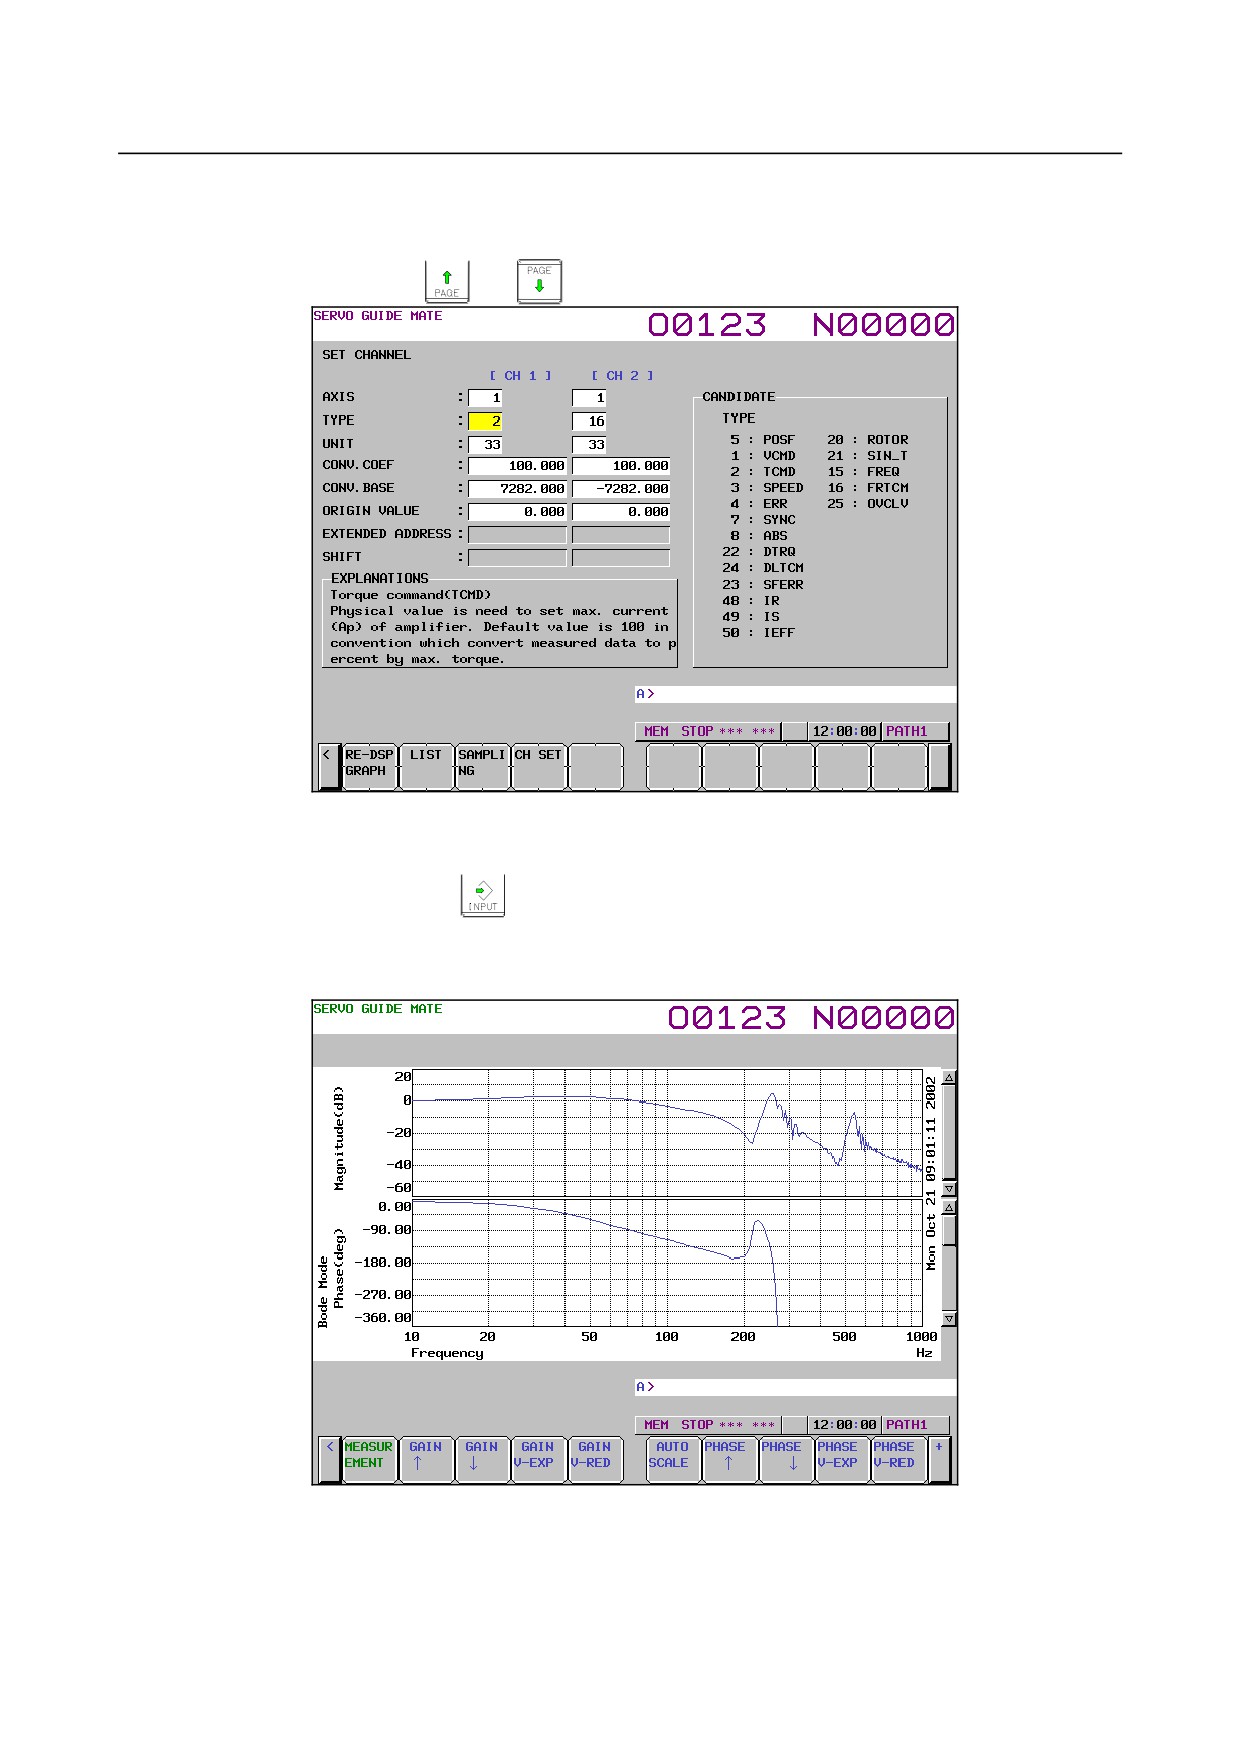
The channel setting screen is displayed as shown Fig. 1.9.1.5 (m).
To set any channel other than the one currently displayed, display the setting screen for the desired
channel by pressing the
or
key.
Fig. 1.9.1.5 (m)
9
Move the cursor to the parameter you want to set, by pressing the cursor key.
10 Enter data and the press the
key.
11 Repeat steps 9 and 10 until you set all the parameters.
12 Click the soft key [RE-DSPGRAPH].
The wave display screen is displayed as shown Fig. 1.9.1.5 (n).
Fig. 1.9.1.5 (n)
13 The new settings will take effect next time you perform measurement. Change the operation/graph
settings and scale settings according to the new channel settings.
- 128 -
B-64485EN/01
1.DISPLAY AND OPERATION
Explanation
-
Setting the data-in screen
See the Explanation section for the Y-time graph describing the setting the data-in screen.
-
Setting the channel setting screen
See the Explanation section for the Y-time graph describing the setting the channel setting screen.
-
Setting the operation and graph setting screen
The operation and graph setting screen lets you specify graph settings.
• Operation
The specifiable values are as shown in Table 1.9.1.5 (b), Bode graph operations.
An operation cannot be specified if it does not meet the graph display conditions defined in Table
1.9.1 (c), Bode graph conditions.
Table 1.9.1.5 (b) Bode graph operations
Input value
Operation name
Description
1
N/A
Not displayed.
41
Bode
Displays a Bode diagram in the form of a horizontal axis logarithm graph.
Table 1.9.1 (c) Bode graph conditions
Operation
Condition
The measurement and channel settings must meet the following conditions.
CHANNEL 1
CHANNEL 2
CHANNEL 3
AXIS
Specify the same servo motor axis.
TYPE
2 : TCMD
16 : FRTCM
15 : FREQ
41 : Bode
UNIT
33 : %
33 : %
32 : Hz
CONV.COEF
100
100
1
CONV.BASE
7282
-7282
1
ORIGIN VALUE
0
0
0
Channel 4 must be disabled (channel 4 axis must be set to0).
-
Setting the scale screen
• Start point
Set gain and phase data values for the center of the graph.
• Division
Set the value of one grid.
• Frequency
Set the minimum and maximum values of the horizontal axis. The unit is Hz.
-
Performing measurement
See the Explanation section for the Y-time graph describing the performing measurement.
Limitation
See the Limitation section for the Y-time graph.
1.9.1.6 Parameters
#7
#6
#5
#4
#3
#2
#1
#0
2270
DSTIN
DSTTAN
DSTWAV
DSTMV
ACREF
[Input type] Parameter input
[Data type] Bit axis
- 129 -

1.DISPLAY AND OPERATION
B-64485EN/01
#3 ACREF Adaptive resonance elimination filter
0: Disabled
1: Enabled
When this function is enabled, disable it temporarily and then use the disturbance input
function.
(This is because the resonance elimination filter changes in response to the vibration of
the axis even if the vibration is caused by the disturbance input function.)
#4 DSTMV Usually, set 0.
#5 DSTWAV The input waveform of disturbance input is:
0: Sine wave.
1: Square wave.
Usually, set 0.
#6 DSTTN Disturbance is:
0: Input for one axis only.
1: Input for both the L and M axes.
Usually, set 0. To be set only for the L axis side of synchronous axes or tandem axes.
#7 DSTIN Disturbance input
0: Stop
1: Start
Disturbance input starts on the rising edge from 0 to 1.
2326
Disturbance input gain
[Input type] Parameter input
[Data type] Word axis
[Unit of data] TCMD unit (maximum amplifier current: 7282)
[Valid data range] 0 to 7282
First, set about 500 to apply vibration to the machine so that light sound is generated.
2327
Start frequency of disturbance input
[Input type] Parameter input
[Data type] Word axis
[Unit of data] Hz
[Valid data range] 1 to 2000
[Guide setting] 10
Set the frequency at which vibration starts.
2328
End frequency of disturbance input
[Input type] Parameter input
[Data type] Word axis
[Unit of data] Hz
[Valid data range] 1 to 2000
[Guide setting] 1000
Set the frequency at which vibration terminates.
2329
Number of disturbance input measurement points
[Input type] Parameter input
[Data type] Word axis
- 130 -
B-64485EN/01
1.DISPLAY AND OPERATION
[Guide setting] 3
Set the number of measurement points by the disturbance input function (number of
vibrations).
For details on the disturbance input function, refer to the PARAMETER MANUAL
(B-65270EN) for the servo motor.
#7
#6
#5
#4
#3
#2
#1
#0
3454
G1B
[Input type] Parameter input
[Data type] Bit path
#4 G1B In programmable parameter input, the change command for a particular bit parameter is:
0: Disabled.
1: Enabled. (The bit number is specified by Q_.)
1.10 MAINTENANCE INFORMATION SCREEN
The maintenance information screen is provided to record the history of maintenance performed by a
service person of FANUC or machine tool builder.
The screen has the following features:
• MDI alphabetical input is allowed.
(Half-size kana input is for Japanese display only.)
• The recording screen can be scrolled in units of lines.
• Edited maintenance information can be input and output.
• Records are stored in Flash ROM.
• Double-byte (shift JIS) codes can be displayed.
1.10.1 Displaying the Maintenance Information Screen
1.
Press function key
2.
Press continuous menu key
several times until soft key [M-INFO] is displayed.
3.
Press the soft key [M-INFO]. The maintenance information screen appears.
When selected, the maintenance screen shows the latest information.
The status (mode, number of empty character spaces, cursor line, column number) is displayed at the
bottom of the screen.
- 131 -