Mitsubishi Montero (1991+). Manual - part 320
the iron core here.
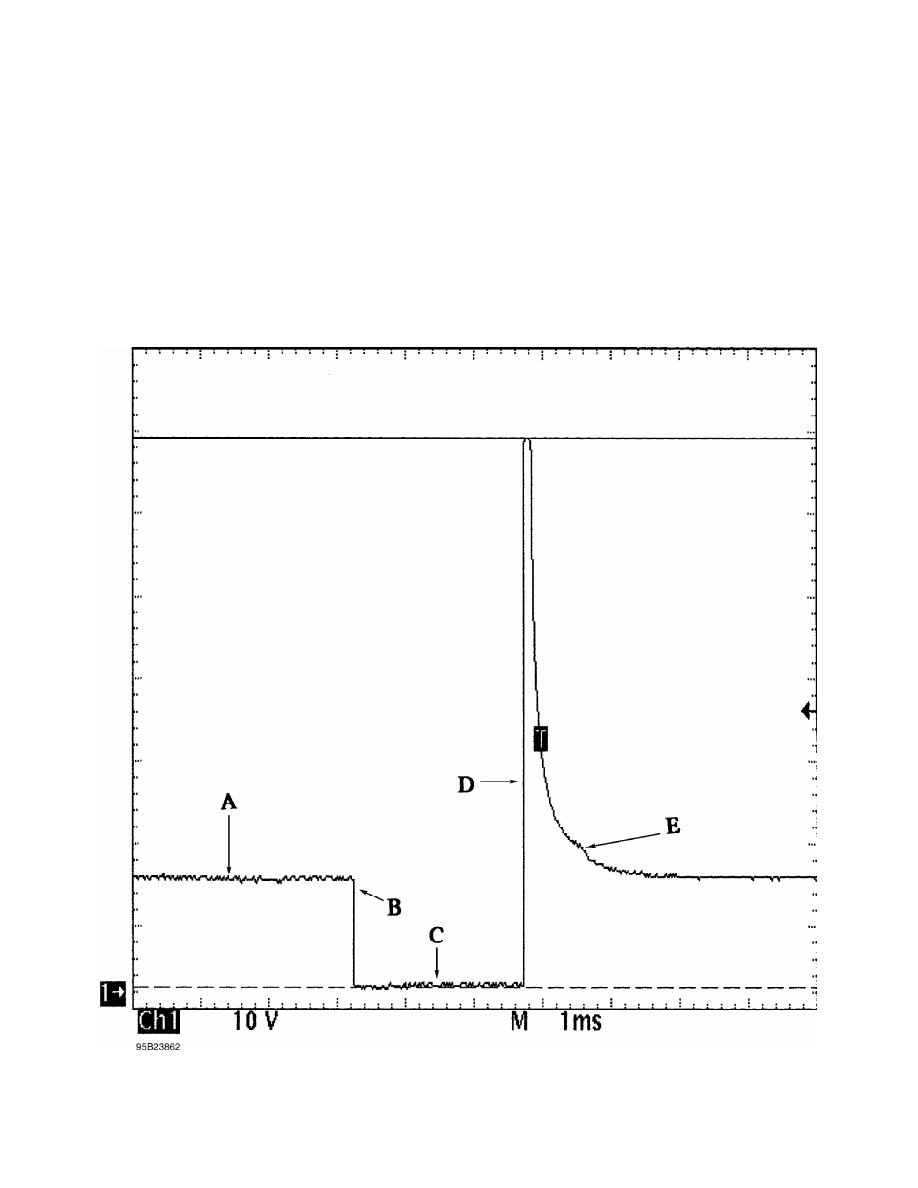
This pintle hump at Point "E" should occur near the end of
the downward slope, and not afterwards. If it does occur after the
slope has ended and the voltage has stabilized, it is because the
pintle is slightly sticking because of a faulty injector
If you see more than one hump it is because of a distorted
pintle or seat. This faulty condition is known as "pintle float".
It is important to realize that it takes a good digital
storage oscilloscope or analog lab scope to see this pintle hump
clearly. Unfortunately, it cannot always be seen.
Fig. 2: Identifying Voltage Controlled Type Injector Pattern
INTERPRETING A CURRENT CONTROLLED PATTERN
NOTE: Current controlled drivers are also known as "Peak and Hold"